by Calculated Risk on 4/16/2011 11:15:00 AM
Saturday, April 16, 2011
Summary for Week ending April 15th
It now appears that Q1 real GDP growth will be less than 2%, but recent data suggests a pickup in March and into April. We will see.
Overall the U.S. story remains the same: manufacturing is the leading the recovery with the NY Fed index (for April) and the Industrial Production report (for March) both showing solid expansion. For more downbeat news, we will hear from housing next week (housing starts and existing home sales). Headline inflation has picked up, although core inflation remains below the Fed’s target. Oil prices are still high, with WTI crude futures near $110 per barrel, and gasoline near $4 per gallon, and these prices are impacting retail sales and are a drag on U.S. and global growth.
Unfortunately there are also several international headwinds. Officials are now talking openly about Greece defaulting, Ireland debt was downgraded, Portugal is negotiating a bailout ... Japan is still struggling, the middle-east and North Africa unrest continues, and China is overheating again. Interesting times.
Below is a summary of economic data last week mostly in graphs:
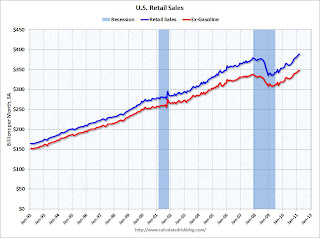
• Retail Sales increased 0.4% in March
 Click on graph for larger image in graph gallery.
On a monthly basis, retail sales increased 0.4% from February to March (seasonally adjusted, after revisions), and sales were up 7.1% from March 2010.
This graph shows retail sales since 1992. This is monthly retail sales, seasonally adjusted (total and ex-gasoline).
Retail sales are up 16.0% from the bottom, and now 2.5% above the pre-recession peak.
 The second graph shows the year-over-year change in retail sales (ex-gasoline) since 1993.
Retail sales ex-gasoline increased by 5.8% on a YoY basis (7.1% for all retail sales).
This was below expectations for a 0.5% increase. Retail sales ex-autos were up 0.8%; slightly above expectations of a 0.7% increase. Retail sales ex-gasoline were only up 0.1% in March - and this shows the impact of higher gasoline prices.
• Trade Deficit decreased in February to $45.8 billion
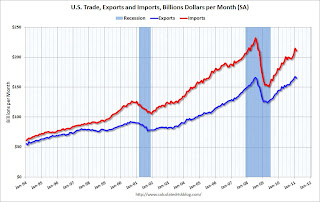 "February exports were $2.4 billion less than January exports of $167.5 billion. February imports were $3.6 billion less than January imports of $214.5 billion."
This graph shows the monthly U.S. exports and imports in dollars through January 2011.
Both imports and exports declined slightly in February (seasonally adjusted). Still exports are now above the pre-recession peak.
The next graph shows the U.S. trade deficit, with and without petroleum, through February.
 "[T]otal February exports of $165.1 billion and imports of $210.9 billion resulted in a goods and services deficit of $45.8 billion, down from $47.0 billion in January, revised."
The blue line is the total deficit, and the black line is the petroleum deficit, and the red line is the trade deficit ex-petroleum products.
The petroleum deficit decreased in February as the quantity declined even as import prices continued to rise - averaging $87.17 in February. Prices will be even higher in March and April. The trade deficit was larger than the expected $44 billion.
• Industrial Production, Capacity Utilization increased in March
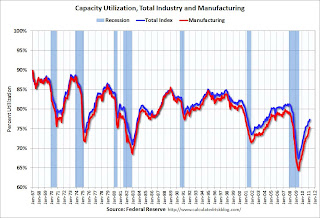 This graph shows Capacity Utilization. This series is up 10 percentage points from the record low set in June 2009 (the series starts in 1967).
Capacity utilization at 77.4% is still "3.0 percentage points below its average from 1972 to 2010" - and below the pre-recession levels of 81.2% in November 2007.
 The next graph shows industrial production since 1967.
Industrial production increased in March to 93.6, however February was revised down from 93.0 to 92.8. So the increase was reported at 0.8% but would have been 0.6% without the downward revision.
Production is still 7.0% below the pre-recession levels at the end of 2007.
The consensus was for a 0.5% increase in Industrial Production in March, and an increase to 77.4% (from 76.3%) for Capacity Utilization. So this was close to expectations.
• NFIB: Small Business Optimism Index decreases in March
From National Federation of Independent Business (NFIB): Hiring Up, But Optimism Down in March
Note: Small businesses have a larger percentage of real estate and retail related companies than the overall economy.
 From NFIB: "The Index of Small Business Optimism gave up 2.6 points in March, falling to 91.9. Four components rose or were unchanged, while six lost ground. The “hard” components of the Index (job creation, job openings, capital spending plans and inventory plans) added two points while the “soft” components (the other six in the table above) gave up 31 points".
This graph shows the small business optimism index since 1986. The index decreased to 91.9 in March from 94.5 in February.
This has been trending up, although the level is still very low.
• BLS: Job Openings increase in February, Highest since 2008
The following graph shows job openings (yellow line), hires (purple), Layoff, Discharges and other (red column), and Quits (light blue column) from the Job Openings and Labor Turnover Summary
 Notice that hires (purple) and total separations (red and blue columns stacked) are pretty close each month. When the purple line is above the two stacked columns, the economy is adding net jobs - when it is below the columns, the economy is losing jobs.
In general job openings (yellow) has been trending up - and are up 23% from February 2010. However the overall turnover remains low.
• Consumer Sentiment increases slightly in April
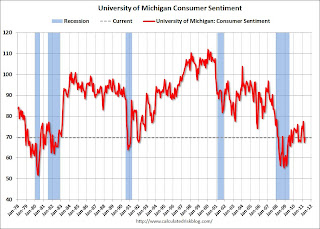 The preliminary April Reuters / University of Michigan consumer sentiment index increased to 69.6 in April from 67.5 in March.
This was slightly above the consensus forecast of 69.0.
In general consumer sentiment is a coincident indicator and is usually impacted by employment (and the unemployment rate) and gasoline prices.
This low reading is probably due to $4 per gallon gasoline prices.
• Core Measures show low inflation in March
The Cleveland Fed released the median CPI and the trimmed-mean CPI: Over the last 12 months, core CPI has increased 1.2%, median CPI has increased 1.2%, and trimmed-mean CPI increased 1.5%.
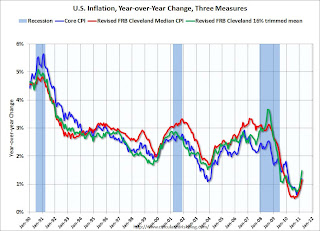 This graph shows these three measure of inflation on a year-over-year basis.
These measures all show that year-over-year inflation is still low, but increasing lately.
A little good news: Core CPI increased at an annualized rate of 1.6% (down from 2.4% in February), median CPI 1.6% annualized in March, and trimmed-mean CPI increased 3.0% annualized (high, but down from 3.8% annualized last month).
• Other Economic Stories ...
• From Reuters: Fed's Yellen says too soon to start reversing policy
• From Bloomberg: Dudley Says Fed Shouldn’t Rush to Tighten Policy ‘Too Early’
• From Fed Vice Chair Janet Yellen: Commodity Prices, the Economic Outlook, and Monetary Policy
• Press Release: Pulse of Commerce Index Jumps 2.7% in March
• Beige Book: Fed sees economic improvement
• From the Empire State Manufacturing Survey indicates faster growth in April
• From Bloomberg: Greece May Need Debt Restructuring, Schaeuble Tells Die Welt
• Unofficial Problem Bank list at 978 Institutions
Best wishes to all!


