by Calculated Risk on 4/08/2011 03:03:00 PM
Friday, April 08, 2011
AAR: Rail Traffic increases in March
Some "D list" transportation data ...
The Association of American Railroads (AAR) reports carload traffic in March 2011 was up up 3.4% over March 2010 and 11.2% over March 2009, and intermodal traffic (using intermodal or shipping containers) was up 8.5% over March 2010 and up 21.6% over March 2009.
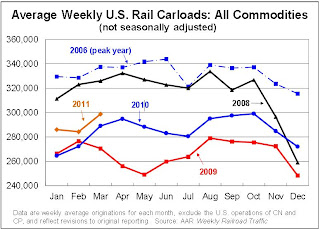
U.S. freight railroads originated an average of 298,711 carloads per week in March 2011, for a total of 1,493,553 carloads — up 3.4% over March 2010 and 11.2% over March 2009. March 2011’s percentage increase is the lowest of any month since rail traffic began its recovery in early 2010, but part of that is because of more difficult comparisons (i.e., year-ago traffic no longer as bleak as it had been).
 Click on graph for larger image in new window.
This graph shows U.S. average weekly rail carloads (NSA).
From AAR:
On a seasonally adjusted basis, U.S. rail carloads were up 2.0% in March 2011 from February 2011. That’s the biggest month-to-month increase in six months and the third seasonally-adjusted increase in the past four months.As the first graph shows, rail carload traffic collapsed in November 2008, and now, over 18 months into the recovery, carload traffic has recovered about half way.
 The second graph is for intermodal traffic (using intermodal or shipping containers):
In March 2011, U.S. railroads averaged 222,260 intermodal trailers and containers per week, for a total of 1,111,301 for the month. That’s up 8.5% (86,908 intermodal units) over March 2010 and up 21.6% (197,423 units) over March 2009.Intermodal traffic is close to old highs, but carload traffic is only about half way back to pre-recession levels.
Seasonally adjusted U.S. rail intermodal traffic was up 0.5% in March 2011 from February 2011, the fourth straight monthly increase.
excerpts with permission


