by Calculated Risk on 2/19/2011 01:35:00 PM
Saturday, February 19, 2011
Schedule for Week of February 20th
There are three key housing reports to be released this week: Case-Shiller house prices on Tuesday, January Existing Home Sales on Wednesday, and January New Home sales on Thursday. Other key economic reports include the 2nd estimate of Q4 GDP to be released on Friday, and Durable Goods on Thursday.
US markets will be closed in observance of Presidents' Day.
9:00 AM: S&P/Case-Shiller Home Price Index for December. Although this is the December report, it is really a 3 month average of October, November and December.
 Click on and graph for larger image in graph gallery.
This graph shows the seasonally adjusted Composite 10 and Composite 20 indices through November (the Composite 20 was started in January 2000).
Prices are falling again, and the Composite 20 index will be close to a new post-bubble low in December. The consensus is for prices to decline about 0.5% in December; the sixth straight month of house price declines.
Morning: Moody's/REAL Commercial Property Price Index (CPPI) for December.
10:00 AM: Conference Board's consumer confidence index for February. The consensus is for an increase to 64.0 from 60.6 last month.
10:00 AM: Richmond Fed Survey of Manufacturing Activity for February. The consensus is for the index to close to the 18 reading last month (above zero is expansion).
1:00 PM: Minneapolis Fed President Narayana Kocherlakota speaks in Pierre, South Dakota.
7:00 AM: The Mortgage Bankers Association (MBA) will release the mortgage purchase applications index. This index increased slightly at the end of last year, and has declined slightly again over the last month to 1997 levels.
Early: The AIA's Architecture Billings Index for January (a leading indicator for commercial real estate).
 This graph shows the Architecture Billings Index since 1996. The index showed expansion in December at 54.2; the highest level since December 2007.
This index usually leads investment in non-residential structures (hotels, malls, office) by 9 to 12 months.
10:00 AM: Existing Home Sales for January from the National Association of Realtors (NAR). The consensus is for sales of 5.2 million at a Seasonally Adjusted Annual Rate (SAAR) in January, slightly below the 5.28 million SAAR in December.
 This graph shows existing home sales, on a Seasonally Adjusted Annual Rate (SAAR) basis since 1993.
 Housing economist Tom Lawler is forecasting a decline to 5.17 millon (SAAR) in January. This would put the months-of-supply in the low 8 months range, probably up slightly from the 8.1 months reported in December.
Along with the release of January existing home sales, the NAR will release revisions for the past three years (2008 through 2010). In addition, the NAR is working on benchmarking existing home sales for previous years with other industry data (expectations are for large downward revisions). These revisions will be announced mid-year.
12:30 PM: Kansas City Fed President Thomas Hoenig speaks in Washington on the economic outlook
1:30 PM: Philadelphia Fed President Charles Plosser speaks in Alabama on the economic outlook
8:30 AM: The initial weekly unemployment claims report will be released. The consensus is for a slight decrease to 403 thousand compared to 410 thousand last week.
8:30 AM: Durable Goods Orders for January from the Census Bureau. The consensus is for a 3.0% increase in durable goods orders after decreasing 2.5% in December.
8:30 AM ET: Chicago Fed National Activity Index (January). This is a composite index of other data.
8:30 St. Louis Fed President James Bullard speaks in Bowling Green, Kentucky on "Monetary Policy Outlook for 2011"
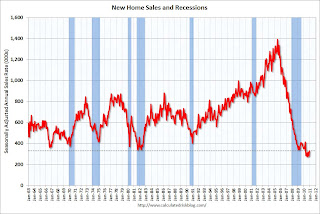
10:00 AM: New Home Sales for January from the Census Bureau. The consensus is for an decrease in sales to 310 thousand (SAAR) in January from 329 thousand in December.
 This graph shows New Home Sales since 1963. The dashed line is the current sales rate.
New home sales collapsed in May and have averaged only 294 thousand (SAAR) over the last eight months. Prior to the last eight months, the record low was 338 thousand in Sept 1981.
10:00 AM: 10:00 FHFA House Price Index for December. This is based on GSE repeat sales and is no longer as closely followed as Case-Shiller (or CoreLogic).
11:00 AM: Kansas City Fed regional Manufacturing Survey for February. The index was at 7 in January.
8:30 AM: Q4 GDP (second estimate). This is the second estimate for Q4 from the BEA, and the consensus is for real GDP growth to be revised to an increase of 3.3% annualized from the advance estimate of 3.2%.
9:55 AM: Reuter's/University of Michigan's Consumer sentiment index (final for February). The consensus is for an increase to 75.4 from the preliminary reading of 75.3.
10:15 Richmond Fed President Jeffrey Lacker and Fed Board nominee Peter Diamond will comment on stress tests at US Monetary Policy Forum, New York, New York
1:30 PM: Vice Chairman Janet Yellen, Panel Discussion on Unconventional Monetary Policy at U.S. Monetary Policy Forum
Possible: FDIC Q4 Quarterly Banking Report
Best Wishes to All!


