by Calculated Risk on 12/05/2010 09:28:00 AM
Sunday, December 05, 2010
Summary for Week ending December 4th
Below is a summary of the previous week, mostly in graphs. Note: here is the economic schedule for the coming week.
• November Employment Report: 39,000 Jobs, 9.8% Unemployment Rate
The following graph shows the employment population ratio, the participation rate, and the unemployment rate.
 Click on graph for larger image in graph gallery.
The unemployment rate increased to 9.8% (red line) from 9.6% in October.
The Employment-Population ratio declined to 58.2% in November matching the cycle low set in 2009 (black line).
The Labor Force Participation Rate was steady at 64.5% in November (blue line). This is the percentage of the working age population in the labor force. The participation rate is well below the 66% to 67% rate that was normal over the last 20 years.
 The second graph shows the job losses from the start of the employment recession, in percentage terms aligned at maximum job losses.
For the current employment recession, employment peaked in December 2007, and this recession is by far the worst recession since WWII in percentage terms, and 2nd worst in terms of the unemployment rate (only the early '80s recession with a peak of 10.8 percent was worse).
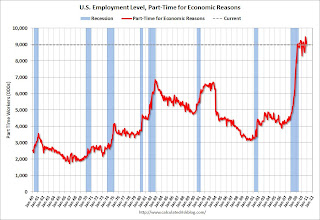
 The number of workers only able to find part time jobs (or have had their hours cut for economic reasons) declined slightly to 8.972 million in November. This has been around 9 million since August 2009 - a very high level.
These workers are included in the alternate measure of labor underutilization (U-6) that was steady at 17.0% in November. The high for U-6 was 17.4% in October 2009. Still very grim.
 This graph shows the number of workers unemployed for 27 weeks or more.
According to the BLS, there are 6.313 million workers who have been unemployed for more than 26 weeks and still want a job. This was up from 6.206 million in October. It appears the number of long term unemployed has peaked, however the level is extremely high - and the increases over the last two months is very concerning.
Most of the underlying details of the employment report were weak. The positives included small upward revisions to the September and October payroll reports, a slight increase in average hourly earnings, and a slight decline in part time workers.
The negatives include the unemployment rate increasing to 9.8%, few payroll jobs added (only 39,000 jobs), the decline in the employment-population ratio, the steady participation rate at a very low level, and the increase in workers unemployed for over 26 weeks.
• Case-Shiller: Broad-based Declines in Home Prices in Q3
S&P/Case-Shiller released the monthly Home Price Indices for September (actually a 3 month average of July, August and September). This includes prices for 20 individual cities, and two composite indices (10 cities and 20 cities), and the quarterly national index.
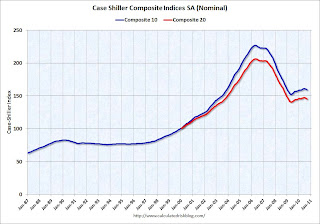
 This graph shows the nominal seasonally adjusted Composite 10 and Composite 20 indices (the Composite 20 was started in January 2000).
The Composite 10 index is off 29.8% from the peak, and down 0.7% in September(SA).
The Composite 20 index is off 29.6% from the peak, and down 0.8% in September (SA).
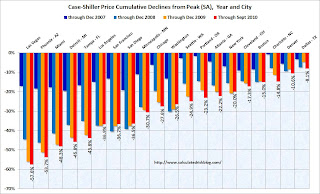
The next graph shows the price declines from the peak for each city included in S&P/Case-Shiller indices.
 Prices increased (SA) in only 1 of the 20 Case-Shiller cities in September seasonally adjusted. Only Wash, D.C. saw a price increase (SA) in September, and that was very small.
Prices in Las Vegas are off 57.6% from the peak, and prices in Dallas only off 8.1% from the peak.
Prices are now falling - and falling just about everywhere. And it appears there are more price declines coming (based on inventory levels and anecdotal reports).
• U.S. Light Vehicle Sales 12.26 million SAAR in November
Based on an estimate from Autodata Corp, light vehicle sales were at a 12.26 million SAAR in November. That is up 13.2% from November 2009, and up slightly from the October 2010 sales rate.
 This graph shows the historical light vehicle sales (seasonally adjusted annual rate) from the BEA (blue) and an estimate for November (red, light vehicle sales of 12.26 million SAAR from Autodata Corp).
This is the highest sales rate since September 2008, excluding Cash-for-clunkers in August 2009.
This was above most forecasts of around 12.0 million SAAR.
• ISM Manufacturing Index decreases slightly to 56.6 in November
From the Institute for Supply Management: November 2010 Manufacturing ISM Report On Business® PMI was at 56.6% in November, down slightly from 56.9% in October. The consensus was for a decrease to 56.5%.
 Here is a long term graph of the ISM manufacturing index.
In addition to the PMI, the ISM's new orders index was down to 56.6 from 58.9 in October.
The employment index decreased to 57.5 from 57.7 in October.
This was inline with the regional Fed manufacturing surveys.
• Other Economic Stories ...
• Restaurant Performance Index Rose to Three-Year High In October
• Hamilton: Europe and China: is this deja vu all over again?
• Michael Pettis: The rough politics of European adjustment.
• From Catherine Rampell at the NY Times: Persistence of Long-Term Unemployment Tests U.S.
• DOT: Vehicle miles driven increased in September
• From the Institute for Supply Management: October 2010 Non-Manufacturing ISM index showed expansion in November
• From the NAR:
Strong Rebound in Pending Home Sales
• ADP: Private Employment increased by 93,000 in November
• Unofficial Problem Bank list increases to 920 Institutions
Best wishes to all!


