 RSS Feed
 by Calculated Risk on 5/09/2010 03:13:00 PM
Sunday, May 09, 2010
Weekly Summary and a Look Ahead
Note: "Extraordinary meeting" of EU finance ministers Press Conference has been delayed. The Press Conference will be here. The previous post has some details.
The financial issues in Europe and the investigation into the stock market breakdown last Thursday will probably be top stories again this week. The key economic report will be April retail sales to be released on Friday.
Sometime this week the April National Federation of Independent Business (NFIB) small business survey will probably be released, and also the April rail traffic report from the Association of American Railroads (AAR) and LA port traffic for April.
On Tuesday the Job Openings and Labor Turnover Survey (JOLTS) for March will be released at 10 AM by the BLS. This report has been showing very little hiring and turnover in the labor market, but with the improvement in the March payroll report, the JOLTS might show more hiring in March. Also on Tuesday, Wholesale Inventories will be released.
The Atlanta Fed conference, Up from the Ashes: The Financial System after the Crisis is on Tuesday and Wednesday. Atlanta Fed President Dennis Lockhart speaks on Tuesday at 1:15 PM ET.
On Wednesday the March Trade Balance report will be released at 8:30 AM by the Census Bureau. The consensus is for a further increase in the U.S. trade deficit to over $40 billion (from $39.7 billion).
On Thursday, the closely watched initial weekly unemployment claims will be released. Consensus is for a decline to 439K from 444K last week.
On Friday March retail sales will be released at 8:30 AM. The consensus is for an increase of 0.2% from the March rate.
Also on Friday the Federal Reserve will release the April Industrial Production and Capacity Utilization report. This is expected to show strong gains. The May Reuter's/University of Michigan's Consumer sentiment index will be released at 9:55 AM, and March Business inventories will be released at 10 AM.
And of course the FDIC will probably have another busy Friday afternoon ...
And a summary of last week:
 Click on graphs for a larger image.
This graph shows the job losses from the start of the employment recession, in percentage terms. This really shows how stunning the job losses were during the great recession.
The recession that started in 2007 was by far the worst recession since WWII in percentage terms, and 2nd worst in terms of the unemployment rate (only early '80s recession with a peak of 10.8 percent was worse).
Note: Census 2010 hiring was 66,000 (NSA) in April.
 This graph shows the employment-population ratio; this is the ratio of employed Americans to the adult population. The Employment-Population ratio increased to 58.8% in April (from 58.6% in March), after plunging since the start of the recession.
 Note: the graph doesn't start at zero to better show the change.
The Labor Force Participation Rate increased to 65.2% from 64.9% in March. This is the percentage of the working age population in the labor force. This is still well below the 66% to 67% rate that was normal over the last 20 years.
 The blue line is the number of workers unemployed for 27 weeks or more. The red line is the same data as a percent of the civilian workforce.
According to the BLS, there are a record 6.72 million workers who have been unemployed for more than 26 weeks (and still want a job). This is a record 4.34% of the civilian workforce. (note: records started in 1948)
The headline number of 290,000 payroll jobs was well above expectations, especially given the level of Census 2010 hiring (this is 224,000 after adjusting for the 66,000 Census 2010 temporary hires). The increase in the unemployment rate was because of people returning to the work force - the decline in the participation rate during the recession was stunning, and it is no surprise that people are once again looking for work.
 The 144,490 consumer bankruptcies filed in April represented a 15 percent increase from April 2009 total. This is the 2nd highest month since the Bankruptcy Abuse Prevention and Consumer Protection Act of 2005 was enacted.
This graph shows the non-business bankruptcy filings by quarter using monthly data from the ABI and previous quarterly data from USCourts.gov.
The American Bankruptcy Institute (ABI) is forecasting over 1.5 million filings in 2010. This is an increase from the just over 1.4 million filings in 2009.
 Based on an estimate from Autodata Corp, light vehicle sales were at a 11.21 million SAAR in April. This is up 21.8% from April 2009 (when sales were at the lowest level in 30 years), and down 4.6% from the March sales rate that was driven by incentives.
This graph shows the historical light vehicle sales (seasonally adjusted annual rate) from the BEA (blue) and an estimate for April (red, light vehicle sales of 11.21 million SAAR from Autodata Corp).
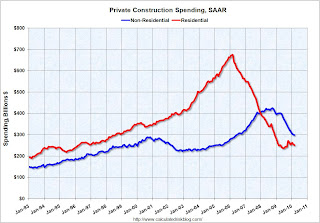 This graph shows private residential and nonresidential construction spending since 1993. Note: nominal dollars, not inflation adjusted.
Private residential construction spending appears to have bottomed in early 2009, but has been mostly moving sideways since then. Residential spending is now 62.8% below the peak of early 2006.
Private non-residential construction spending continues to decline as major projects are completed. Non-residential spending is now 29.9% below the peak of late 2008.
Best wishes to all.


