by Calculated Risk on 3/12/2010 10:00:00 AM
Friday, March 12, 2010
Manufacturing and Trade Inventory-to-Sales Ratio: Inventory Adjustment Over
The Manufacturing and Trade Inventories and Sales report from the Census Bureau today showed that the inventory-to-sales ratio was mostly back to normal in January.
Manufacturers' and trade inventories, adjusted for seasonal variations but not for price changes, were estimated at an end-of-month level of $1,310.2 billion, virtually unchanged (±0.1%)* from December 2009 and down 8.6 percent (±0.3%) from January 2009.
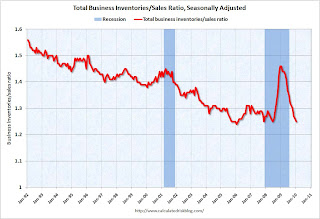
Inventories/Sales Ratio. The total business inventories/sales ratio based on seasonally adjusted data at the end of January was 1.25. The January 2009 ratio was 1.46.
 Click on graph for larger image in new window.
This graph shows the 3 month change (annualized) in manufacturers’ and trade inventories. The inventory correction was slow to start in the 2007 recession, but it now appears the inventory adjustment is over. Growth in inventories will depend on increases in underlying demand.
 The second graph shows the inventory to sales ratio. This has declined sharply to 1.25 (SA) from the peak of 1.46 back in Dec 2008. This could decline further - the trend is definitely down over time - but clearly most of the inventory adjustment is over.
This is important because the change in inventory added significantly to Q4 GDP growth. (See BEA line 13: the contribution to GDP in Q4 from 'Change in private inventories' was 3.88 of the 5.9 percent annualized increase in GDP.)
Any boost to Q1 GDP from inventory changes will be minor in comparison to Q4.


