by Calculated Risk on 10/23/2009 10:00:00 AM
Friday, October 23, 2009
Existing Home Sales Increase in September
The NAR reports: Big Rebound in Existing-Home Sales Shows First-Time Buyer Momentum
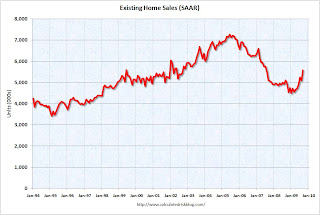
Existing-home sales – including single-family, townhomes, condominiums and co-ops – jumped 9.4 percent to a seasonally adjusted annual rate of 5.57 million units in September from a level of 5.10 million in August, and are 9.2 percent higher than the 5.10 million-unit pace in September 2008.
...
Total housing inventory at the end of September fell 7.5 percent to 3.63 million existing homes available for sale, which represents an 7.8-month supply2 at the current sales pace, down from an 9.3-month supply in August.
 Click on graph for larger image in new window.
The first graph shows existing home sales, on a Seasonally Adjusted Annual Rate (SAAR) basis since 1993.
Sales in Sept 2009 (5.57 million SAAR) were 9.4% higher than last month, and were 9.2% higher than Sept 2008 (5.1 million SAAR).
Here is another way to look at existing homes sales: Monthly, Not Seasonally Adjusted (NSA):
 This graph shows NSA monthly existing home sales for 2005 through 2009. For the fourth consecutive month, sales were higher in 2009 than in 2008.
 It's important to note that many of these transactions are either investors or first-time homebuyers. Also many of the sales are distressed sales (short sales or REOs).
Early information from a large annual consumer study to be released November 13, the 2009 National Association of Realtors® Profile of Home Buyers and Sellers, shows that first-time home buyers accounted for more than 45 percent of home sales during the past year. A separate practitioner survey shows that distressed homes accounted for 29 percent of transactions in September.
 The third graph shows nationwide inventory for existing homes. According to the NAR, inventory decreased to 3.63 million in September (August inventory was revised upwards significantly). The all time record was 4.57 million homes for sale in July 2008. This is not seasonally adjusted.
Typically inventory peaks in July or August, so some of this decline is seasonal.
 The fourth graph shows the 'months of supply' metric for the last six years.
Months of supply was decline to 7.8 months.
Sales increased, and inventory decreased, so "months of supply" declined. A normal market has under 6 months of supply, so this is still high.
It is important to note that sales in September were distorted by the first time home buyer tax credit, and this activity will fade - whether or not the credit is extended.


