by Calculated Risk on 10/26/2009 06:59:00 PM
Monday, October 26, 2009
CRE Prices: Healthy and Distressed
Last week it was reported CRE prices were off 41% according to the Moodys/REAL Commercial Property Price Index (CPPI).
MIT Professor David Geltner discusses the index and the differences between price declines for healthy and distressed properties: Where we are in the aggregate: A two-year anniversary ... (pdf)
Note: Dr. Geltner's column appears on Real Estate Analytics LLC website on the lower right under "Professor's Corner".
From Dr. Geltner:
August 2009 marks the two-year anniversary of the CPPI’s “real peak”, that is, the price index peak adjusted for inflation (the nominal peak was two months later). To celebrate, the CPPI fell for the eleventh month in a row, dropping another 3.5 points, or 3%, to a value just above 114, down from 192 in October 2007. Through August the index is down 29% in 2009, 33% over the past 12 months, and close to 41% since that 192 value in October 2007. The current index level of 114 implies average market transaction prices in August 2009 at levels where they were in the spring of 2003.
 Click on graph for larger image in new window.
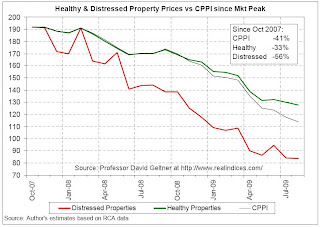
This graph from Dr. Geltner shows the price declines for healthy and distressed properties.
Based on the same repeat-sales database as the CPPI, the chart uses RCA’s identification of “troubled assets” to produce separate indices of “healthy” and “distressed” property price movements since the October 2007 peak. The chart reveals that, through August 2009, while the overall CPPI has dropped 41%, “distressed” properties (indicated by the RCA “troubled asset” designation) have dropped 56%, while “healthy” properties (those not flagged by the RCA “troubled asset” designation) have dropped “only” 33%.** See Dr. Geltner's piece for a description of the methodology.
The chart of the “healthy” and “distressed” property price movements since the peak provides a compelling visualization of the bifurcation in the U.S. commercial property market that many industry participants have noted anecdotally.There is much more in the piece.
...
Sales of “healthy” properties has remained nearly stagnant. Distressed property transactions made up a record 25% of the repeat-sales observations in the August CPPI.


