by Calculated Risk on 4/02/2009 01:02:00 PM
Thursday, April 02, 2009
Credit Crisis Indicators
Here is a quick look at a few credit indicators:
First, the British Bankers' Association reported that the three-month dollar Libor rates were fixed at 1.166%. The LIBOR was at 1.30% a couple of weeks ago, and peaked at 4.81875% on Oct 10, 2008. This is near the January 14th low of 1.0825%. Click on graph for larger image in new window.
The first graph shows the spread between 30 year Moody's Aaa and Baa rated bonds and the 30 year treasury.
There has been some increase in the spread the last few weeks, but the spread is still below the recent peak. The spreads are still very high, even for higher rated paper, but especially for lower rated paper.
Of course the default risk has increased significantly, especially for lower rated paper. Yesterday, Moody's warned of the worst corporate default rate since at least WWII.
Corporate America's credit quality collapsed in the first quarter, with Moody's Investors Service downgrading an estimated $1.76 trillion of debt, a record high ... The downgrades included a record number to the lowest rating categories, signaling the approach of the worst defaults since at least World War Two, Moody's chief economist John Lonski said in an interview.The Moody's data is from the St. Louis Fed:
emphasis added
Moody's tries to include bonds with remaining maturities as close as possible to 30 years. Moody's drops bonds if the remaining life falls below 20 years, if the bond is susceptible to redemption, or if the rating changes.
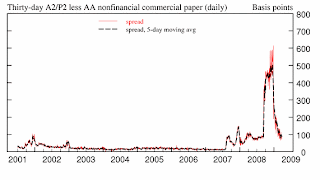
 There has been improvement in the A2P2 spread. This has declined to 0.93. This is far below the record (for this cycle) of 5.86 after Thanksgiving, but still above the normal spread.
This is the spread between high and low quality 30 day nonfinancial commercial paper.
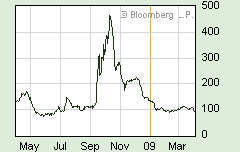
 | Meanwhile the TED spread has decreased further over the last week, and is now at 95.3. This is the difference between the interbank rate for three month loans and the three month Treasury. The peak was 463 on Oct 10th and a normal spread is around 50 bps. |
 This graph shows the at the Merrill Lynch Corporate Master Index OAS (Option adjusted spread) for the last 2 years.
This is a broad index of investment grade corporate debt:
The Merrill Lynch US Corporate Index tracks the performance of US dollar denominated investment grade corporate debt publicly issued in the US domestic market.The recent surge in this index was a cause for alarm, but the index appears to have stabilized - and has declined over the last week.
All of these indicators are still too high, but there has been some progress.


