by Calculated Risk on 10/21/2008 12:41:00 AM
Tuesday, October 21, 2008
Graphs: Housing Starts and Builder Confidence
Here are the graphs for housing starts and builder confidence based on the data released while out I was out hiking last week. Click on graph for larger image in new window.
Total housing starts were at an annual pace of 817K units in September, the lowest rate since Jan 1991 (798K SAAR).
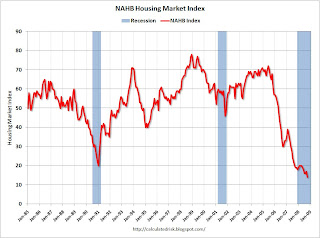
Starts for single family structures (544K) were the lowest since Feb 1982 (541K). The Census Bureau has been tracking starts since Jan 1959, and the lowest month for single family structures was Oct 1981 (523K units SAAR) - so it is possible that a new record low will be set in October 2008.  The second graph shows the builder confidence index from the National Association of Home Builders (NAHB).
Builder confidence index was at a record low in October.
Usually housing bottoms look like a "V"; this one will probably look more like an "L". (this refers to activity like starts and sales, but will probably also be apparent in the confidence survey).


