by Calculated Risk on 9/24/2008 09:47:00 AM
Wednesday, September 24, 2008
August Existing Home Sales Decline
From NAR: Existing-Home Sales Slide on Tight Mortgage Availability
Existing-home sales were down in August following a healthy gain in July as tight mortgage credit curtailed activity, according to the National Association of Realtors®. Sales rose in the Midwest and South but fell in the Northeast and West.
Nationally, existing-home sales – including single-family, townhomes, condominiums and co-ops –declined 2.2 percent to a seasonally adjusted annual rate1 of 4.91 million units in August from an upwardly revised pace of 5.02 million in July, but are 10.7 percent below the 5.50 million-unit pace in August 2007.
Total housing inventory at the end of August fell 7.0 percent to 4.26 million existing homes available for sale, which represents a 10.4-month supply at the current sales pace, down from a revised 10.9-month supply in July.
 Click on graph for larger image in new window.
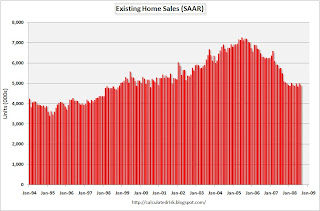
The first graph shows existing home sales, on a Seasonally Adjusted Annual Rate (SAAR) basis since 1993.
Sales in August 2008 (4.91 million SAAR) were the weakest August since 1998 (4.74 million SAAR).
It's important to note that a large percentage of these sales were foreclosure resales (banks selling foreclosed properties). The NAR suggested two months ago that "short sales and foreclosures [account] for approximately one-third of transactions". Although these are real transactions, this means activity (ex-foreclosures) is running around 3.3 million SAAR.
 The second graph shows nationwide inventory for existing homes. According to NAR, inventory decreased to 4.26 million in August, from an all time record 4.67 million homes for sale in July. Usually inventory peaks in mid-Summer, so July was probably the peak for inventory this year.
 This decline was the normal seasonal pattern.
Most REOs (bank owned properties) are included in the inventory because they are listed - but not all. Some houses in the foreclosure process are listed as short sales - so those would be counted too.
 The third graph shows the 'months of supply' metric for the last six years.
Months of supply declined to 10.4 months.
This follows the highest year end months of supply since 1982 (the all time record of 11.5 months of supply).
My forecast was for Months of Supply to peak at about 12 months this year and this metric was pretty close.
I expect sales to fall further over the next few months, although I think inventory has peaked for the year.


