by Calculated Risk on 7/21/2008 02:20:00 PM
Monday, July 21, 2008
Office Investment
Recently I've posted articles on office vacancies in Orange County and San Diego. Click on graph for larger image in new window.
Here is a photo from lunatic fringe in Orange County, CA:
[I drove] down the street and [to see] how leasing was going at the new office park at Jeffrey and the 5. It doesn't look too good, I think maybe 6-7 of the buildings were partially or fully leased and the remaining 15 or so were empty as can be. ... What's sad is this complex has been open for leasing since late 2007.The other photos showed mostly see through buildings too. And these are some of the smaller building for lease - along the 405 there are several much larger see throughs.
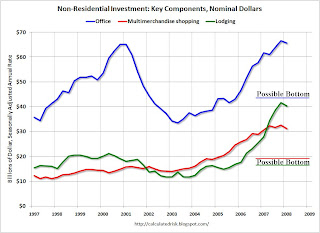
Office investment is one of the three key components of non-residential investment in structures that will probably decline in the 2nd half of 2008 (and into 2009). The three key areas are: office buildings, multimerchandise shopping, and lodging.
 This graph shows the investment in each of the categories in nominal dollars. See here for investment as percent of GDP. My estimate for a possible investment bottom are marked in red, green and blue and labeled "possible bottom".
 Note: data from the BEA. The BEA started breaking out office and multimerchandise shopping in 1997.
This is why I keep posting on offices, malls, and hotels. Of these three categories, office investment is the largest, but was also the least overbuilt during the recent boom. Offices were overbuilt during the late '90s because of the stock bubble, so it took some time to get the current office boom started.
 The second graph shows office investment as a percent of GDP since 1972.
NOTE: In 1997, the Bureau of Economic Analysis changed the office category. In the earlier years, offices included medical offices. After '97, medical offices were not included (The BEA presented the data both ways in '97).
This shows the huge over investment in offices in the '80s due to the S&L lending (and eventual crisis). This graph also shows the office building boom associated with the stock market bubble.
The most recent office boom was smaller as a percent of GDP than the late '90s boom. However the booms for malls and lodging were larger this time - and the busts, on a percentage basis, will probably be larger for malls and lodging too. All three categories will see declines in investment later this year.


