by Calculated Risk on 5/02/2008 11:57:00 AM
Friday, May 02, 2008
Flawed House Price Indices, Flawed Reporting
In the comments, Jerome asks about this article at MarketWatch discussing the various measures of house prices: Home-price data has its flaws
The S&P/Case-Shiller index, which Tuesday posted a 12.7% decline for February, is skewed for two reasons of its own -- it tracks just 20 major markets, many among the hardest hit, and its "repeat sales" survey by design pulls in individual homes both bought and sold in the last few years.This is flawed reporting.
First, the article is referring to the S&P/Case-Shiller Composite 20 Index, not the S&P/Case-Shiller U.S. National Home Price Index (released quarterly). The media constantly confuses these indices. The National Index starts in 1987, and has a 20 year history of tracking price changes. The second part of the argument - that the price survey uses "repeat sales" and is capturing "homes both bought and sold in the last few years" - is a strength, and does not "skew" the data.
The following graph shows the year-over-year change for the S&P/Case-Shiller National Home Price Index, the Composite 20 (twenty large cities), the Composite 10 (10 large cities), and the OFHEO HPI (seasonally adjusted / purchase only).
 Click on graph for larger image.
The composite 10 and 20 indices saw the most appreciation because they are only tracking large cities, mostly in "bubble" areas. Now that prices are falling, the declines are larger in these two indices.
The National Index is only released quarterly, and the data for Q1 will be released in late May. The Case-Shiller national index will probably be off close to 12% YoY. Currently (as of Q4) the national index is off 10.1% from the peak.
Instead of correcting each point in the article, let me excerpt from our March Newsletter with a discussion on the different house price methods: A Question of Price.
Probably the two most frequently asked questions about the housing market are 1) How far have prices fallen? And 2) how much further will prices fall?
Both questions are somewhat difficult to answer. First it helps to understand the differences between the various data sources.
The National Association of Realtors (NAR), DataQuick, and others, report the median house price; they take all the recent sales, and find the median price. This can be distorted by the mix of homes sold. When the bubble first burst, the median price continued to rise because fewer lower end houses were sold (the low end portion of the market with subprime loans slowed first). Now with jumbos being limited, the high end sales volume has fallen, and the median price has fallen quickly.
There is a better method of tracking house prices based on repeat sales of the same house, an idea developed by Professors Karl Case of Wellesley College and Robert Shiller of Yale University in the 1980s. Using repeat sales, and adjusting for several factors (improvements, sales to family members, and more), gives a much better picture of price changes.
There are two main house price indices that use the Case-Shiller repeat sales method; 1) the Office of Federal Housing Enterprise Oversight House Price Index (HPI), and 2) the S&P/Case-Shiller® U.S. National Home Price Index.
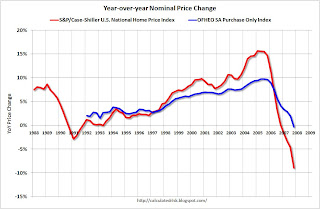
But Case-Shiller and OFHEO still give very different results as shown in the following graph.

When comparing the national Case-Shiller and OFHEO indices, there are a number of differences: OFHEO covers more geographical territory, OFHEO is limited to GSE loans, OFHEO uses both appraisals and sales (Case-Shiller only uses sales), and some technical differences on adjusting for the time span between sales.
The above graph shows the national indices from OFHEO (purchase only, no appraisals) and Case-Shiller. The Case-Shiller index shows a more dramatic rise in prices in early 2000s, and is now showing a more dramatic decline. All data is through the end of 2007; there is strong anecdotal evidence of further declines so far in 2008.
The second graph presents the same data on a year-over-year price change basis. Once again this shows that the Case-Shiller index was indicating more price appreciation in recent years, and is now showing a larger decline.

The Case-Shiller index suggests prices are off 8.9% over the last year, and 10.1% from the peak. OFHEO’s Purchase Only index shows prices are essentially flat year-over-year, and off 2.5% from the peak.Data Sources:
OFHEO economist Andrew Leventis’ research suggests that the main reason for the recent price difference between the Case-Shiller and OFHEO indices was that prices for low end non-GSE homes declined significantly faster than homes with GSE loans. This was probably due to the lax underwriting standards on these non-GSE subprime loans.
Note that Leventis' research focused on the differences in the indices for the period from Q3 2006 through Q3 2007. I suspect the Case-Shiller index will continue to see larger price declines than OFHEO as lending standards have now been tightened significantly for other non-GSE loans (especially jumbo loans).
What Leventis’ research suggests is to me is that the Case-Shiller index probably provides the best available estimate of house prices for selected cities, but might overestimate the national house price decline.
OFHEO 4Q 2007 Purchase-Only and Seasonally-Adjusted Purchase-Only U.S. Index
S&P: S&P/Case-Shiller® U.S. National Home Price Values
It's important to understand that even the S&P/Case-Shiller National index has limited geographical coverage. To understand the areas covered, see pages 27 through 32 of S&P/Case-Shiller® Home Price Indices Methodology. Basically the National index covers about 70% of the U.S. by value, and the missing 30% are rural areas (areas that probably had less appreciation, and prices are probably declining less now than in the major cities). As I stated in the article, the Case-Shiller index might overstate the national price declines. A reasonable approach might be to take 70% of Case-Shiller and 30% of OFHEO for national prices.
And finally, just ignore the NAR on house prices.


