by Calculated Risk on 1/18/2008 03:44:00 PM
Friday, January 18, 2008
Housing: Seasonal Inventory
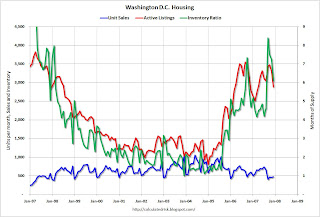
To illustrate the seasonal pattern for housing, here is some housing data (through December) for Washington D.C. sent to me by reader dc1000. The data shows a 13% decline in inventory, from 3,307 units in November to 2,880 units in December. Sales for December were at the lowest level since dc1000 has been keeping statistics, starting in '97. Click on graph for larger image.
This graph shows the sales, inventory and months of supply for Washington, D.C.
Note the sharp decline in inventory in December (and months of supply).
Inventory and "months of supply" are not seasonally adjusted in this calculation. The normal seasonal pattern (nationally) is for inventory to decline about 15% in December as sellers remove their homes from the market for the holidays.
Remember this when the National Association of Realtors (NAR) announces that inventory declined in December!
Note: in this case both sales and inventory are NSA (not seasonally adjusted). So "months of supply" is also not seasonally adjusted. The NAR seasonally adjusts sales, but not inventory. So the NAR "months of supply" calculation is a little weird; a seasonally adjusted number being compared with a non-seasonally adjusted number. For new homes sales, the Census Bureau seasonally adjusts both sales and inventory.


