 RSS Feed
 by Calculated Risk on 12/01/2006 02:31:00 PM
Friday, December 01, 2006
The Housing Optimists
In spite of the steady stream of bad news for housing, there are a growing number of forecasters and stock analysts that are bullish on housing and housing stocks. They believe the worst is over, and the bottom is near for the housing market.
From the LA Times this morning: Optimism is rising on housing market
Falling mortgage rates and a rally in home builder stocks are leading some analysts to suggest that the worst of the nation's housing slump may be over.And from the Motley Fool: On the Up-And-Up
Although data released Thursday showed U.S. home prices making their smallest quarterly gain in eight years, some forward-looking indicators point to a stabilizing residential market.
Home builder stocks rallied sharply Thursday after an analyst's upgrade. The sector was one of the strongest in November, with the Standard & Poor's home builder index gaining 10% last month, extending a rally that began in July and suggesting that investors see an improving outlook.
"While this real estate cycle has yet to play itself out, we are skeptical of the dire warnings of pundits," Zachary Karabell and Daniel Chung, analysts at investment firm Fred Alger & Co., said Wednesday in a client note.
The homebuilders are rising again, and for good reason: They are beginning to discount better conditions in the housing market. ... Bank of America Securities analyst Daniel Oppenheim upgraded several of the builder stocks today, saying he sees an "improvement in traffic, affordability and construction trends." ...The Citigroup analysts seem to put significant weight on prices. I'm not sure what the Citigroup analysts were expecting, but in a typical housing bust, prices first flatten out, and then decline over a multi-year period. My housing price predictions for 2006 (from December 2005):
Even with the upgrade and recent stock rally, many analysts still remain cautious -- if not outright bearish -- on the sector. ...
Oppenheimer himself seemed to proceed with caution, despite his upgrade. "We do not expect a smooth upward move, but expect choppiness over the next 12-24 months based on the excess inventory, as it will take time to work through the oversupply," he said in Thursday's research note to clients.
He fails to see the big picture, as do so many of the current housing bears. They remain micro-focused on inventory without seeing inventory in relation to sales. They fail to put inventory in context, which is a serious analytical mistake. Every industry looks at the inventory-to-sales ratio, and housing should be no exception. Having said that, consider that the ratio of single-family housing starts to sales is now at the lowest level since the government started recording this data in 1963.
... Stop listening to these know-nothings talk about the inventory, because it will soon be coming down -- and when it does, they will be scrambling to upgrade their views.
... median prices will probably increase slightly, with declines in the more "heated markets".For housing prices, so far, I'm seeing about what I expected. So I'm surprised the Citigroup analysts see prices as a positive. Perhaps they viewed the boom as based on fundamentals, as opposed to my view that there was excessive speculation. As I've noted before, how one viewed the boom, colors how one views the bust.
With regards to the Motley Fool piece, the Starts to Sales ratio does tell you when an industry is starting to work down any excess inventory. But you also have to analyze the level of excess inventory.
Of course, it also helps to use the correct data! The Motley Fool writer used single family starts that includes homes being built by the owner. This is the wrong number to compare to sales.
 Click on graph for larger image.
To calculate Starts to Sales, you should use the Single Family starts, built for sale numbers from the Census Bureau. This series is quarterly and begins in 1974.
This graph shows the correct Starts to Sales ratio (note 2006 is through the first 3 quarters, and I included the ratio for Q3 2006). Apparently I'm a "know-nothing", but at least I'm using the correct data series.
But the above analysis only tells us when the builders are starting to work off the excess inventory - and that hasn't started yet since starts are still higher than sales. We also need to look at the current inventory. And not just inventory of New Homes, but inventory of competing products: existing homes and rentals.
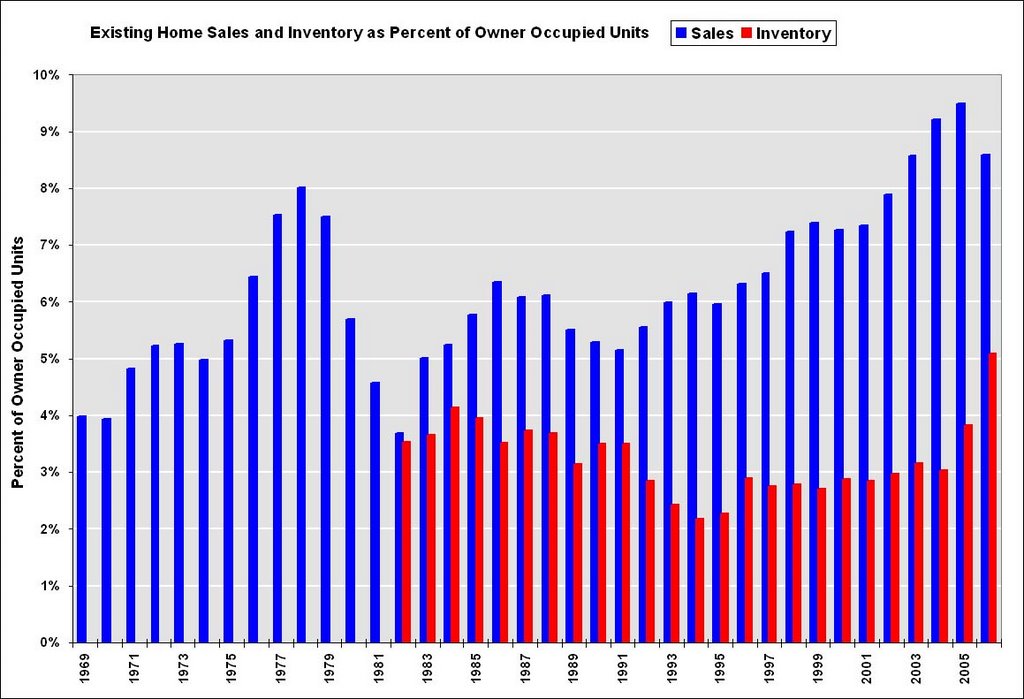 As I noted yesterday, inventories of existing homes are at about 5% as a percent of total owner occupied units. This is an all time record, and is well above the median inventory levels of 3% of owner occupied units.
This high level of existing home inventory should depress new home sales and put pressure on prices.
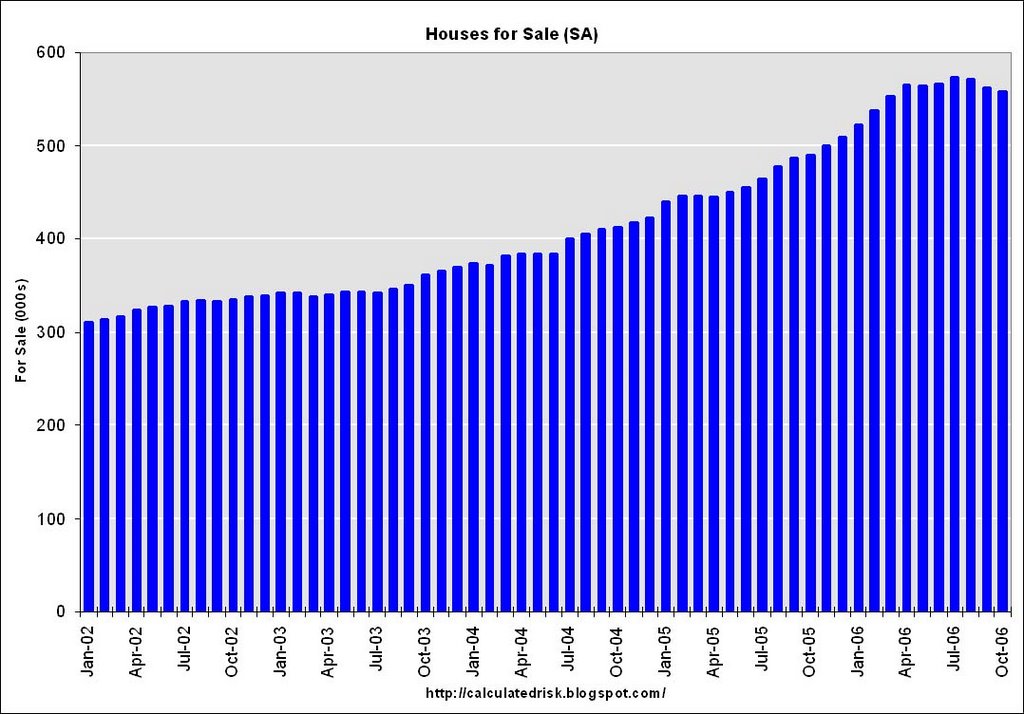
And we also need to look at new home inventories. Currently the Census Bureau is reporting inventory of 558,000 units. Inventory numbers from the Census Bureau do not include cancellations - and cancellations are at record levels. Actual New Home inventories are much higher - some estimates about 20% higher.
All and all, I don't find any of the optimists' arguments the least bit convincing.


