 RSS Feed
 by Calculated Risk on 12/29/2006 02:56:00 PM
Friday, December 29, 2006
Housing in 2007
For the overall U.S. economy in 2007, the overwhelming consensus view is for a soft landing, with real GDP growth between 2.5% and 3.0%. Although there are several frequently mentioned risks to this view - such as inflation, higher energy prices, a currency crisis, exogenous events - the housing market is probably the main downside risk to the economy.
So how will the housing market perform in 2007?
Let's start with what we know:
1) Inventories are at record levels.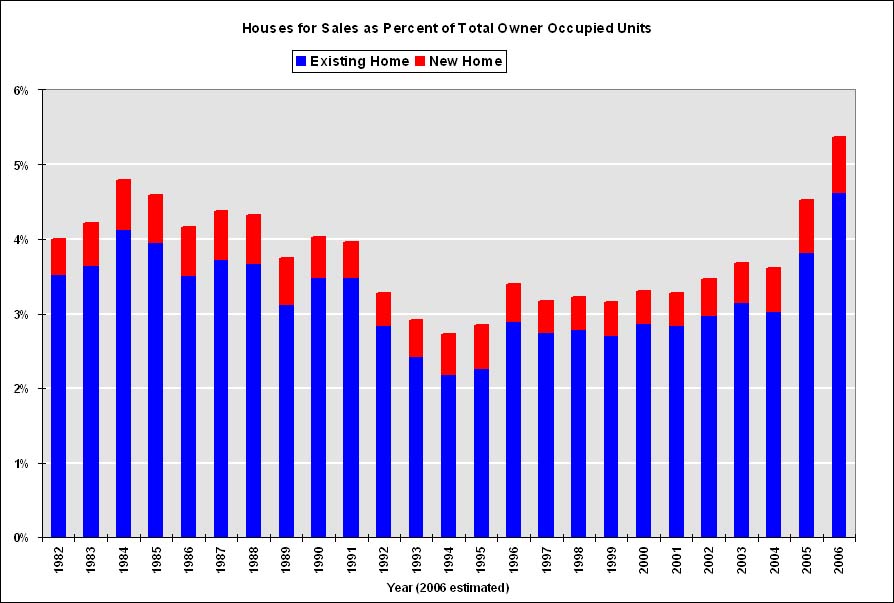 Click on graph for larger image.
This graph shows the total houses for sale (existing and new) as a percent of total owner occupied units. Year 2006 is estimated as 3.5 million existing homes and 0.55 million new homes for sale. Both of these estimates might be low; at the end of November there were 3.82 million existing homes for sales, and if cancellations are included in new home inventory, there are probably close to 0.65 million new homes for sale.
But even with these conservative estimates, 2007 will be starting off with a record number of houses for sale.
2) Households are already dedicating a record percentage of their income to mortgage obligations.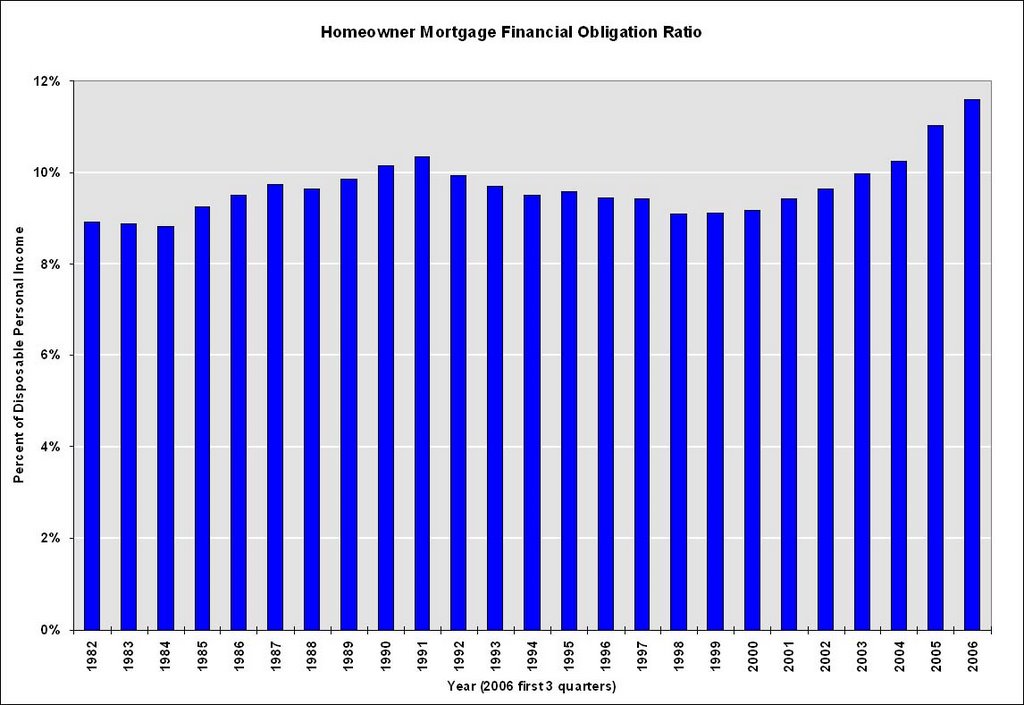 Source: Federal Reserve
As the Fed notes, the important aspect of this series are the changes in household debt service obligations. Even with historically low interest rates, households are already dedicating a record portion of their income to mortgage obligations.
3) Homeowners have a record low percentage of equity in their homes.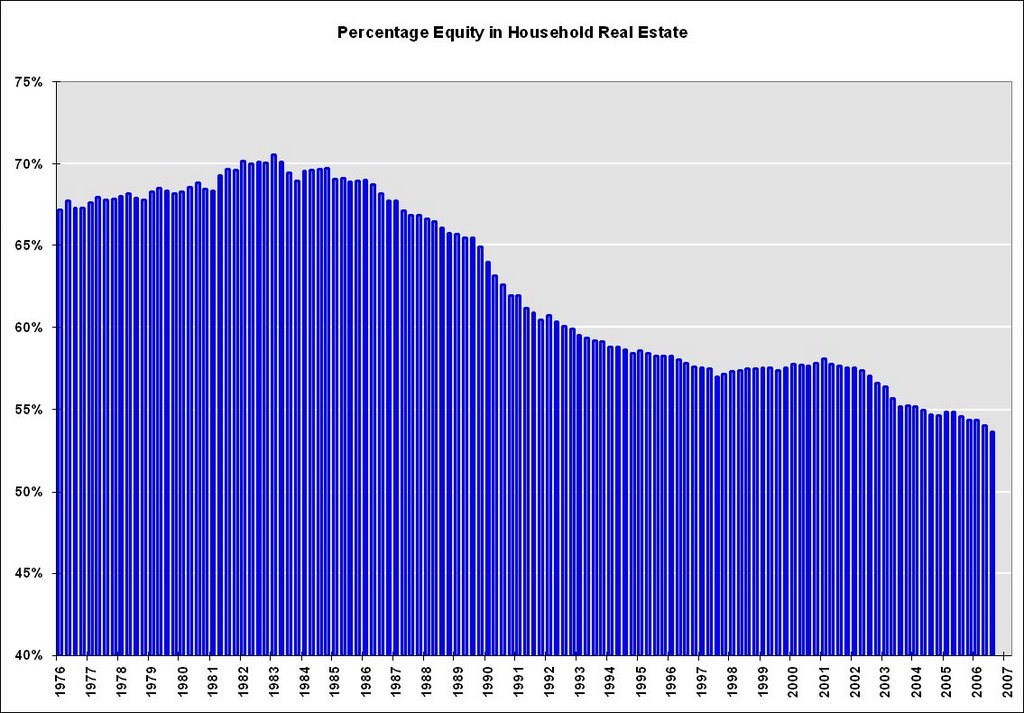 Note: Graph doesn't start at zero to better show change in percent equity.
The Fed recently reported that homeowner equity, as a percent of market value, fell to a record low 53.6%, compared to 54.0% in Q2, and 54.6% one year ago.
This probably indicates that more and more homeowners have maxed out their "home ATM". More on this later.
And now let's add what we're pretty certain will happen:
4) We will see record residential construction job losses in 2007.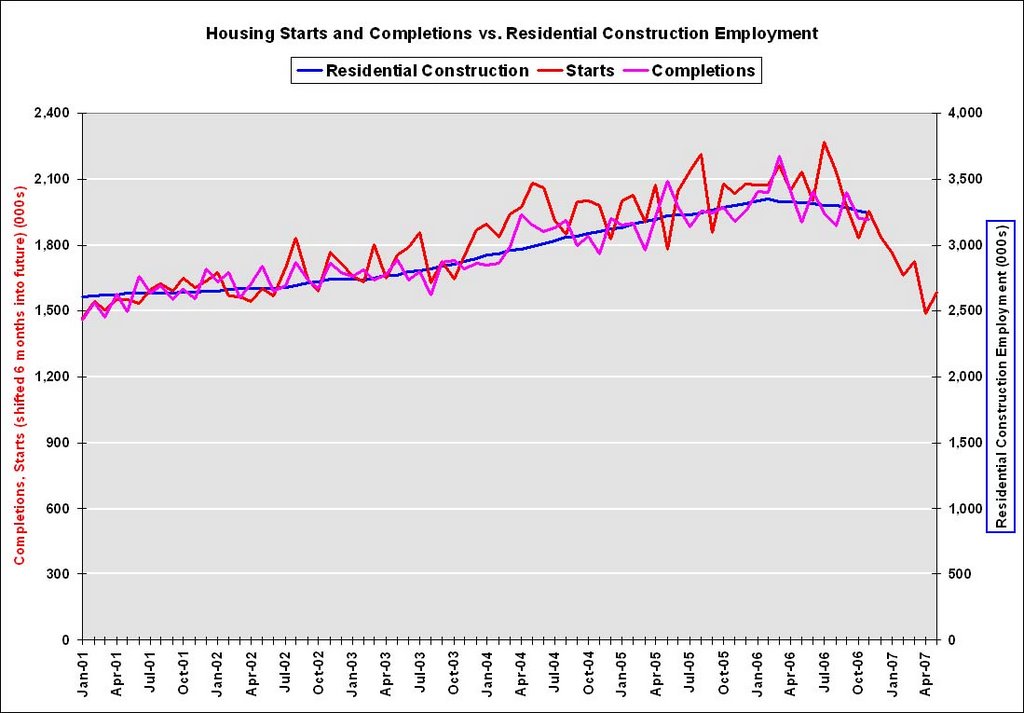
This graph shows starts, completions and residential construction employment. (starts are shifted 6 months into the future). Completions and residential construction employment are highly correlated, and Completions lag Starts by about 6 months.
Based on historical correlations, it is reasonable to expect Completions and residential construction employment to follow Starts "off the cliff". This would indicate the loss of 400K to 600K residential construction employment jobs over the next 6 months.
5) Foreclosures will be approaching record levels in some states. Source: DataQuick through Q3 2006. 2007 estimated at Q4 2006 rate.
This graph shows the number of Notice of Defaults (NODs) filed in California since 1992. Although DataQuick has only released data through Q3, it now appears 2006 will have the highest number of defaults since 1998. At the current pace, 2007 might see a record number of NODs.
Less certain is the amount of overbuilding that occurred in recent years.
6) In earlier posts here and here, I tried to estimate the amount of recent overbuilding. This is important for estimating how far starts might fall in 2007.
Let's put it together and make some predictions for 2007.
A) House Prices will decline: The current record inventory, and the impending foreclosures, will put pressure on prices in 2007. This fits the historical pattern; typically the second year of a housing bust is when prices start to fall. Usually housing busts are local, but since this boom was widespread, the bust will probably be widespread.
I've seen a variety of estimates for 2007. UBS is projecting a 10% price decline in '07. Pimco's Parikh thinks nominal prices will be flat:
"We believe nationwide home prices -- as measured by the federal OFHEO repeat sales index -- will be roughly unchanged in 2007. O.C. prices, on same scale, likely down 5 percent or so. The risk to our price forecast is to the downside."My estimate is prices will fall nominally by 1% to 3% nationwide by all measures (OFHEO, NAR).
The reason for the projection of a small price decline, even with record levels of inventory, is that real estate prices display strong persistence and are sticky downward. So housing "bubbles" typically do not "pop", rather prices deflate slowly in real terms, over several years. Sellers tend to want a price close to recent sales in their neighborhood, and buyers, sensing prices are declining, will wait for even lower prices.
So we have to distinguish between projections for 2007 and the entire bust cycle. As an example, Dr. Thornberg is projecting:
"Whether prices go down or stay the way they are, you can pretty much guarantee that whatever the value of your house now, that's going to be the value of your house in 2011."Over the course of the entire bust, Dr. Gary Shilling expects
"at least a 20% decline in median single-family house prices nationwide, and that number may be way understated."In an efficient market, prices would clear immediately, and we would see the entire price decline in a short period. However since prices are sticky, real estate markets do not clear immediately, and instead we see a drop in transactions, so ...
B) Transactions will decline.
Fannie Mae is projecting existing home sales will fall to 5.925 million units in '07 (from 6.425 million), and new home sales to 0.975 million units (from 1.05 million). I think both numbers might be optimistic.
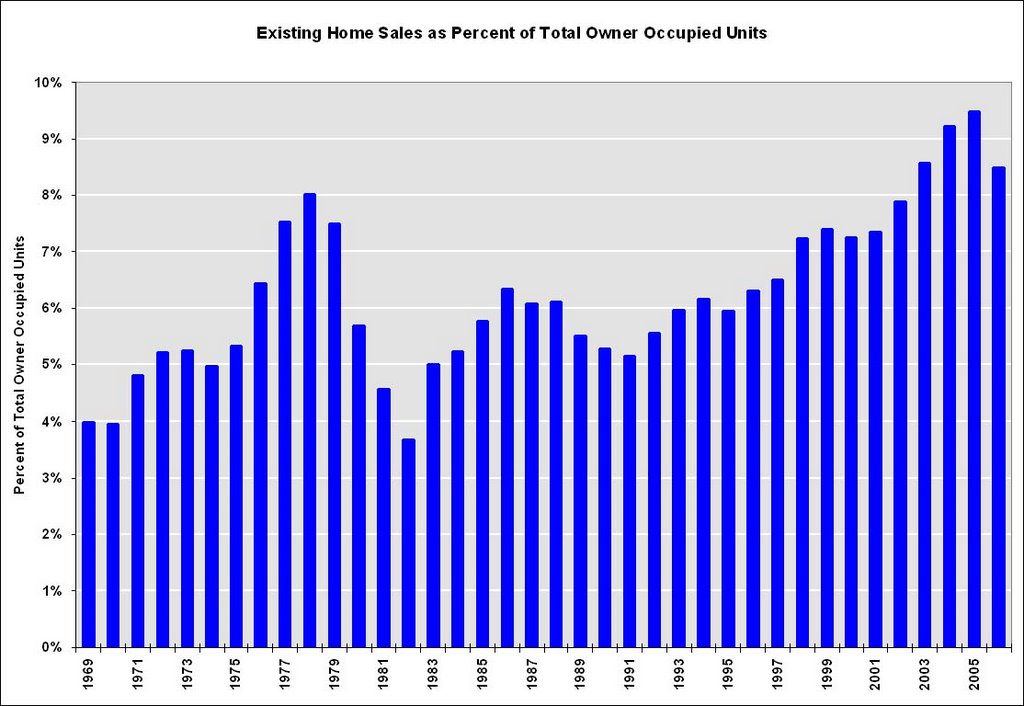 One of the rarely told stories of the housing boom was the jump in turnover of existing homes. This graph shows sales normalized by the number of owner occupied units. This shows the extraordinary level of sales for the last few years, reaching 9.5% of owner occupied units in 2005. The median level is 6.0% for the last 35 years.
Some of the sales were for investment and second homes, but normalizing by owner occupied units probably provides a good estimate of normal turnover. If sales fell back to 6% that would about 4.6 million units. If sales fell back to the level of 1998 to 2001 (7.3% of total owner occupied units sold) that would be about 5.6 million units in 2007.
With falling prices, my guess is existing home sales will "surprise" to the downside, perhaps in the 5.6 to 5.8 million unit range. Based on my estimate of overbuilding in recent years (see point 6 above), I believe new home sales will also surprise to the downside.
C. Mortgage Equity Withdrawal will decline.
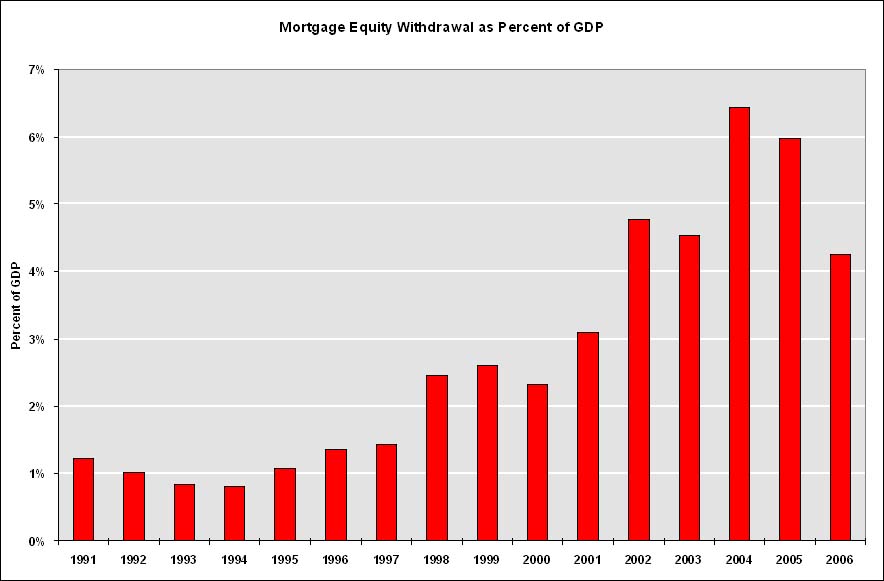 This graph shows Mortgage Equity Withdrawal (MEW) as a percent of GDP, using the Greenspan-Kennedy method.
With stable or falling home prices, already record mortgage obligations, and a record low percentage of equity in their home, MEW will probably be significantly less in 2007. The impact on consumer spending is unclear, but it will be a drag on economic growth.
This gives an overview of the 2007 housing market: falling prices, falling sales, falling residential construction employment, falling starts, falling MEW, falling percentage of equity, and rising foreclosures.
Will this be enough to tip the economy into recession? I still don't know, but I'll make a prediction before the year starts.
ECRI: "Recession is no Longer a Serious Concern"
by Calculated Risk on 12/29/2006 11:17:00 AM
From Reuters: Gauge of U.S. economy falls in latest week
The Economic Cycle Research Institute ... said its Weekly Leading Index slipped to 138.5 in the week ending Dec. 22 from 139.7 in the prior week, due to higher interest rates and more jobless claims.And from Bloomberg: On consumer confidence
However, annualized growth in the week ended Dec. 22 rose to 3.8 percent from 3.4 percent in the prior period, a reading not reached since last February.
"Given the steady improvement in the WLI, recession is no longer a serious concern," said Lakshman Achuthan, managing director at ECRI.
"This really just points to the fact that the economy is experiencing a soft landing and no recession," said Lynn Franco, director of the Conference Board's Consumer Research Center, in an interview. "It speaks volumes about the resiliency of the consumer."Other than a few economists, the overwhelming consensus view is for a soft landing and GDP growth of 2.5% to 3.0% in 2007.
Thursday, December 28, 2006
November Existing Home Sales
by Calculated Risk on 12/28/2006 10:54:00 AM
The National Association of Realtors (NAR) reports: November Existing-Home Sales Rise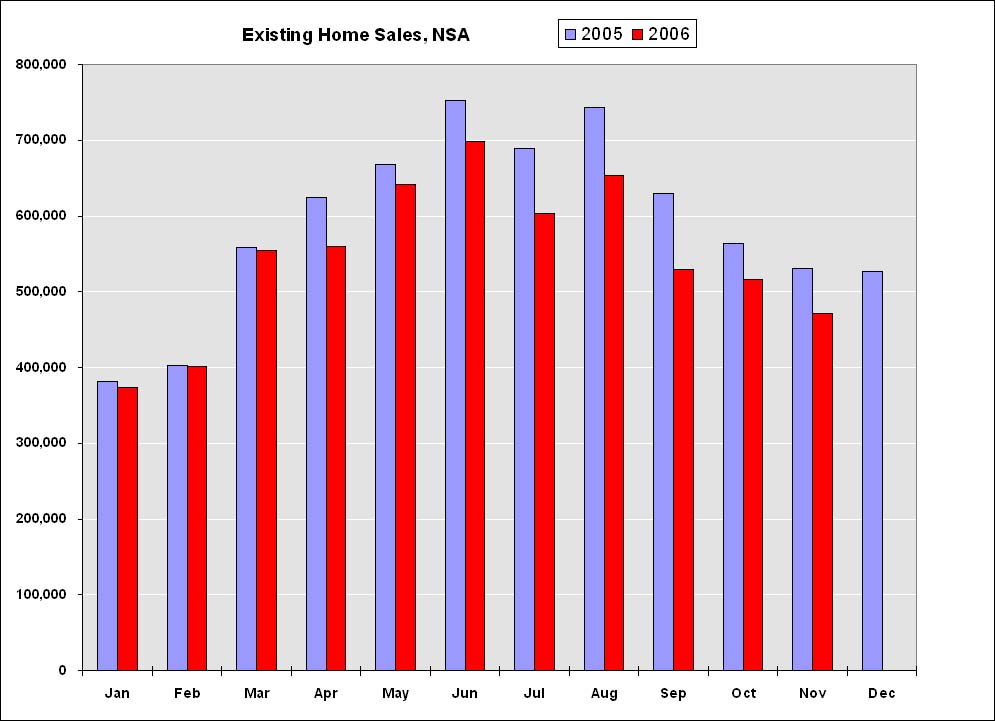 Click on graph for larger image.
Total existing-home sales – including single-family, townhomes, condominiums and co-ops – rose 0.6 percent to a seasonally adjusted annual rate of 6.28 million units in November from a level of 6.24 million in October, but were 10.7 percent below the 7.03 million-unit pace in November 2005.The above graph shows NSA monthly sales for 2005 and 2006. On an NSA basis, sales were 11.1% below November 2005.

Total housing inventory levels fell 1.0 percent at the end of November to 3.82 million existing homes available for sale, which represents a 7.3-month supply at the current sales pace.
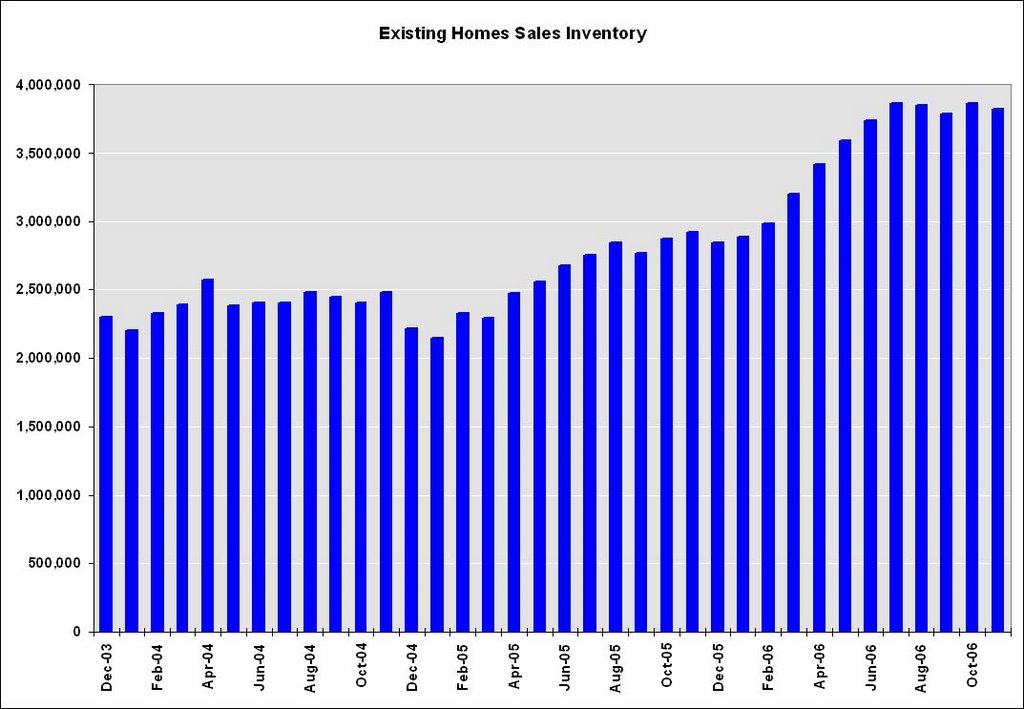 As I've noted before, usually 6 to 8 months of inventory starts causing pricing problems and over 8 months a significant problem. With current inventory levels at 7.4 months of supply, inventories are now well into the danger zone and prices are falling in most regions. Nationwide prices were off 3.1% from November 2005.
Wednesday, December 27, 2006
GDP Growth: With and Without Mortgage Equity Withdrawal
by Calculated Risk on 12/27/2006 01:11:00 PM
UPDATE: Please be sure to see this later post explaining this graph. The graph is accurate, but can be misleading, and several commentators have described the graph incorrectly. The impact of MEW isn't cumulative, and looking at the graph I can see how people thought it was (so I've discontinued using the graph)..
Original post deleted because of confusion. See the above link for the graph.
More on November New Home Sales
by Calculated Risk on 12/27/2006 12:07:00 PM
Please see the previous post: November New Home Sales Click on graph for larger image.
One of the most reliable economic leading indicators is New Home Sales.
New Home sales were falling prior to every recession of the last 35 years, with the exception of the business investment led recession of 2001. This should raise concerns about a possible consumer led recession in the months ahead.
Some more optimistic observers will argue that sales have fallen back to a sustainable level after the excesses of 2004 and 2005. Others will argue that sales have to fall more in coming years, to make up for the excesses of recent years. That is one of the reasons 2007 will be such an interesting year.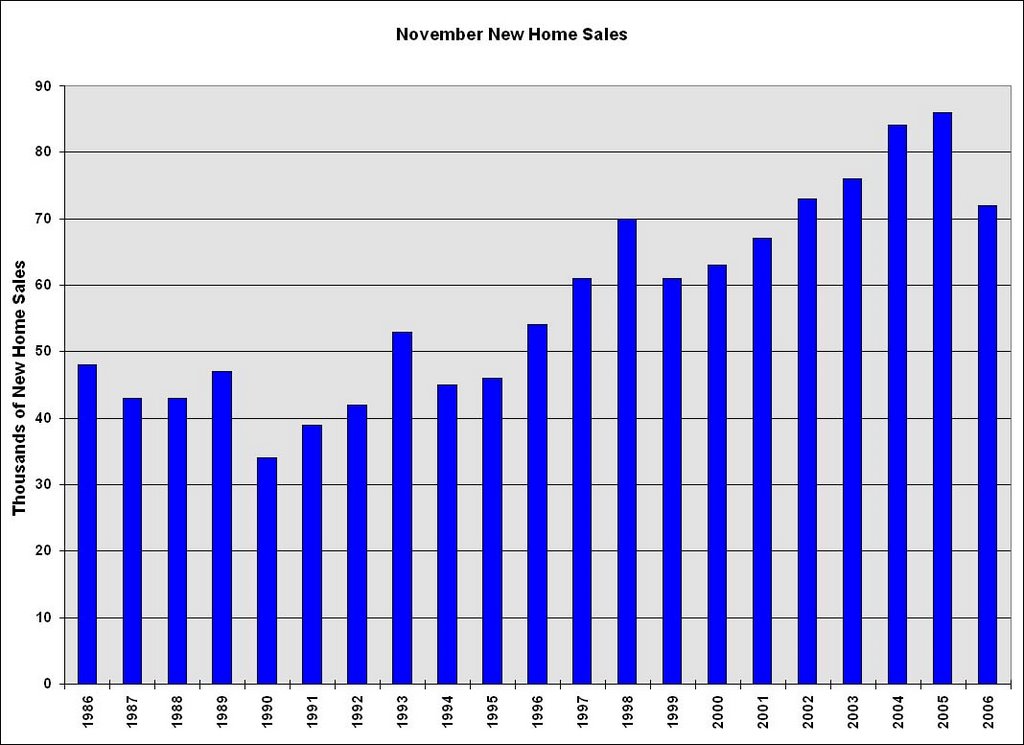
The second graph shows November New Home sales for the last 20 years. The recent sharp drop in sales is similar to the decrease at the start of the 1990s housing bust.
Also note that November sales have fallen below the 2002 levels.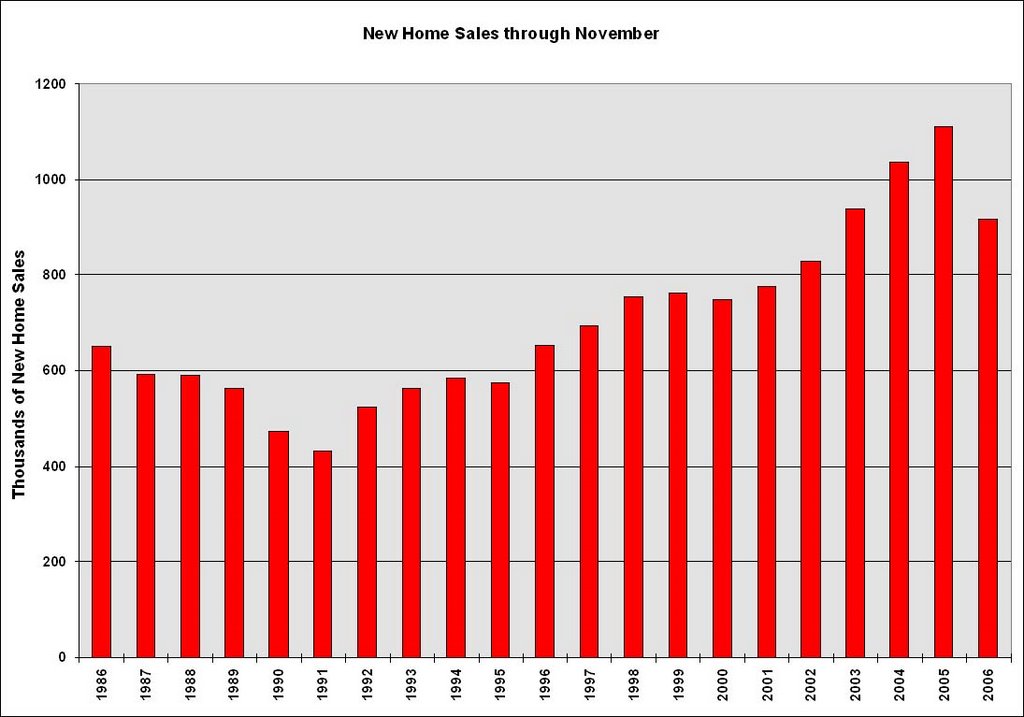
The third graph shows YTD New Home sales through November. It now appears that 2006 will finish as the 4th best year behind 2003.
Sales for the most recent months have fallen to the 2002 level. Fannie Mae is currently estimating that sales for 2007 and 2008 will be at the 2002 level (about 975K units). I think sales will fall further, perhaps to the level of the 1998 through 2001 period, or about 900K units in 2007.
November New Home Sales: 1.047 Million SAAR
by Calculated Risk on 12/27/2006 10:24:00 AM
According to the Census Bureau report, New Home Sales in November were at a seasonally adjusted annual rate of 1.047 million. Sales for October were revised up to 1.013 million, from 1.004 million. Numbers for August and September were also revised up slightly too. 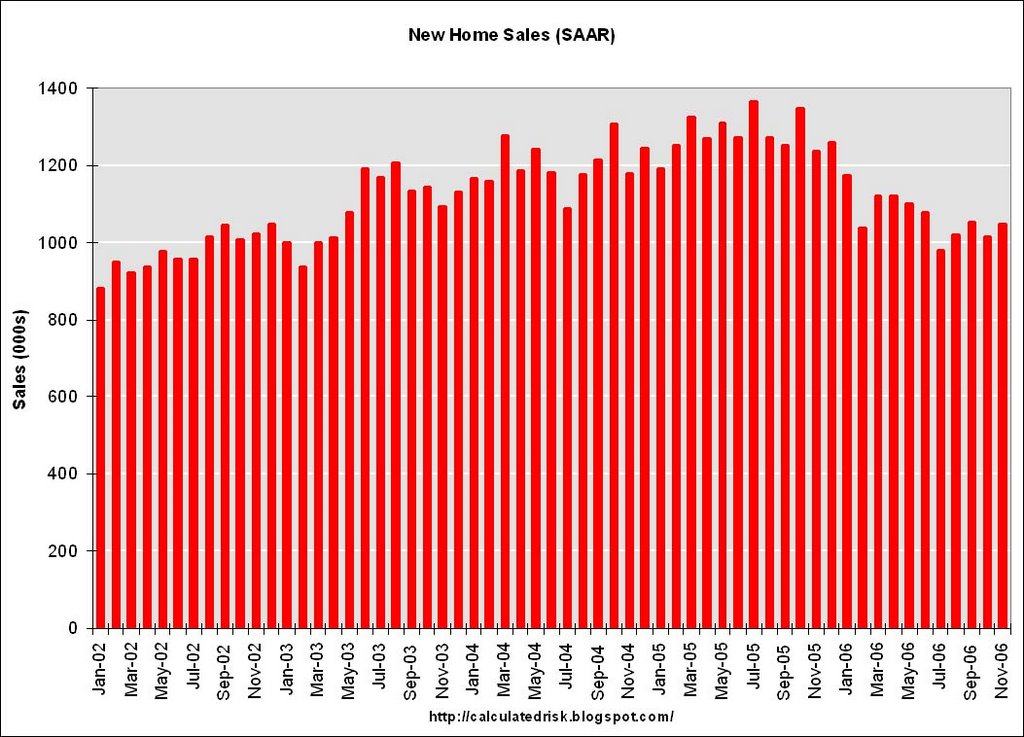
Click on Graph for larger image.
Sales of new one-family houses in November 2006 were at a seasonally adjusted annual rate of 1,047,000, according to estimates released jointly today by the U.S. Census Bureau and the Department of Housing and Urban Development. This is 3.4 percent above the revised October rate of 1,013,000, but is 15.3 percent below the November 2005 estimate of 1,236,000.
The Not Seasonally Adjusted monthly rate was 72,000 New Homes sold. There were 86,000 New Homes sold in November 2005.
On a year over year NSA basis, November 2006 sales were 16.3% lower than November 2005. Also, November '06 sales were below November 2004 (84,000) and November 2003 (76,000) sales.
This is the lowest November since 2001 when 67,000 new homes were sold.
The median and average sales prices were mixed. Caution should be used when analyzing monthly price changes since prices are heavily revised.
The median sales price of new houses sold in November 2006 was $251,700; the average sales price was $294,900.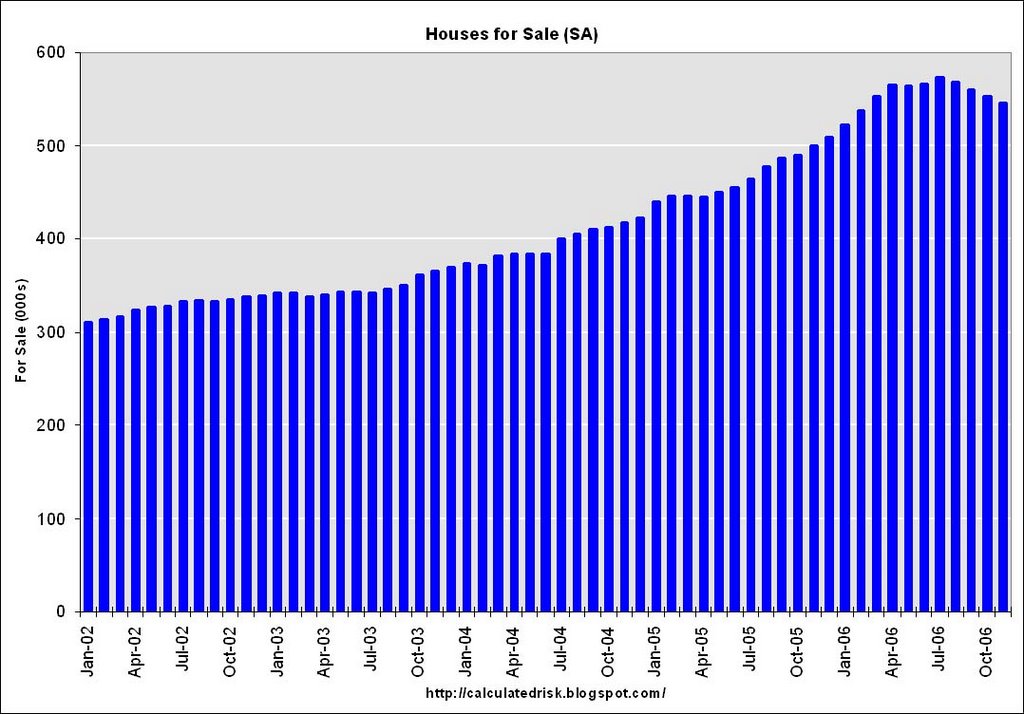
The seasonally adjusted estimate of new houses for sale at the end of November was 545,000.
The 545,000 units of inventory is slightly below the levels of the last six months. Inventory numbers from the Census Bureau do not include cancellations - and cancellations are at record levels. Actual New Home inventories are much higher - some estimate about 20% higher.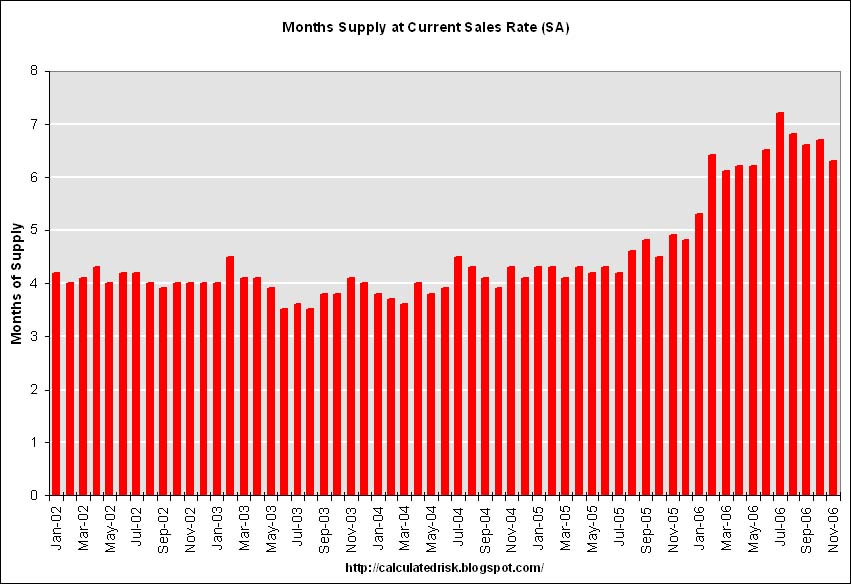 This represents a supply of 6.3 months at the current sales rate.
On a months of supply basis, inventory is above the level of recent years.
More later today on New Home Sales.
Immigrant Worker: "There's no work here anymore."
by Calculated Risk on 12/27/2006 01:26:00 AM
From the WaPo: Immigrants' Jobs Vanish With Housing Slowdown
The gold rush came in drywall, laminate flooring and granite countertops ...The housing starts data suggests that 400K to 600K BLS reported jobs will be lost in residential construction over the next six months. But many more jobs will be lost by illegal immigrants working in construction. And the loss of these jobs matter too:
Then sometime last year ... the rush began to go bust, little by little, month by month. The contractors stopped hiring. The phone stopped ringing. Washington, it seemed, had all the houses it could hold.
... On Jan. 20, he is taking his family back to El Salvador, with plans to open an auto repair shop with the money he has saved. "There's no work here anymore,"
...
"A slowdown in the construction industry hits illegals much harder than the rest of the general population," [said Steven A. Camarota, research director of the Center for Immigration Studies.]
The effects of the slowdown are also rippling through Hispanic-owned businesses. "A lot of my customers have gone to Florida, to the Carolinas," said Carlos Castro, owner of the Todos Supermarket chain and chairman of the Hispanic Business Council in Prince William County.
Sales are down slightly at Castro's stores, but he said some of his suppliers are experiencing 30 to 40 percent decreases in local orders, with smaller, less-established businesses taking the biggest hit.
MBA: Mortgage Applications Decrease
by Calculated Risk on 12/27/2006 12:20:00 AM
The Mortgage Bankers Association (MBA) reports: Mortgage Applications Decrease in Week before Christmas Click on graph for larger image.
The Market Composite Index, a measure of mortgage loan application volume, was 555.8, a decrease of 14.2 percent on a seasonally adjusted basis from 647.6 one week earlier. On an unadjusted basis, the Index decreased 15 percent compared with the previous week and was up 16.6 percent compared with the same week one year earlier.Mortgage rates increased:
The Refinance Index decreased by 18.5 percent to 1604.6 from 1968.8 the previous week and the seasonally adjusted Purchase Index decreased by 10.6 percent to 390.2 from 436.5 one week earlier.
The average contract interest rate for 30-year fixed-rate mortgages increased to 6.12 from 6.10 percent ...
The average contract interest rate for one-year ARMs increased to 5.87 percent from 5.82 ...
 The second graph shows the Purchase Index and the 4 and 12 week moving averages since January 2002. The four week moving average is down 1 percent to 429.3 from 433.4 for the Purchase Index.
The refinance share of mortgage activity decreased to 48.8 percent of total applications from 50.8 percent the previous week. The adjustable-rate mortgage (ARM) share of activity decreased to 23.1 from 23.6 percent of total applications from the previous week. The ARM share is at its lowest level since October 2003.
Tuesday, December 26, 2006
2007 Economic Growth: The Consensus View
by Calculated Risk on 12/26/2006 11:19:00 AM
From the USA Today: Growth or recession in 2007?
In a poll of 21 prominent economists conducted by the Securities Industry and Financial Markets Association (SIFMA), the respondents expected economic growth of a median 2.5% in 2007, down from 3.3% in 2006.So the consensus view for 2007 is just below trend growth. See the USA today article for quotes from various forecasters.
But the difference of opinion is big. In the survey by SIFMA, the estimates for gross domestic product growth ranged from 1.6% to 2.9%.
Monday, December 25, 2006
The "anti-Goldilocks economy"
by Calculated Risk on 12/25/2006 11:58:00 PM
From the NY Times: An Economy of Extremes
Economists have long waxed lyrical about a “Goldilocks economy”— one that is not too hot, not too cold.Too hot and too cold - definitely not "just right". The NY Times presents several differing views on the impact of the housing bust on the general economy. However ...
...
The “just right” economy is not often achieved, of course, but lately this bedtime story has taken a particularly tricky turn: it is both too hot and too cold.
...
Lombard Street Research, a British economic forecasting firm, recently dubbed the American economy the “anti-Goldilocks economy.”
There is one crucial weakness to all the forecasts ... Part way through the bust of perhaps the strongest housing boom on record ... Nobody has ever seen how a situation like this unwinds ...there are enough uncertainties to warrant talk of a recession.Even Fannie Mae is upping the probabilities of a recession:
...
“If housing is as unhelpful on the way down as it was helpful on the way up, we will get a recession,” Mr. [Allen Sinai, president and chief global economist at Decision Economics] said.
“We’ve increased the probability of a recession in our forecast to 35 percent,” said David W. Berson, chief economist of Fannie Mae.
Sunday, December 24, 2006
Happy Holidays!
by Calculated Risk on 12/24/2006 12:22:00 AM

Out through the fields and the woodsLove greatly. Enjoy the season!
And over the walls I have wended;
I have climbed the hills of view
And looked at the world, and descended;
I have come by the highway home,
And lo, it is ended.
The leaves are all dead on the ground,
Save those that the oak is keeping
To ravel them one by one
And let them go scraping and creeping
Out over the crusted snow,
When others are sleeping.
And the dead leaves lie huddled and still,
No longer blown hither and thither;
The last lone aster is gone;
The flowers of the witch-hazel wither;
The heart is still aching to seek,
But the feet question ‘Whither?’
Ah, when to the heart of man
Was it ever less than a treason
To go with the drift of things,
To yield with a grace to reason,
And bow and accept the end
Of a love or a season?
Reluctance by Robert Frost From A Boy's Will, 1913.
Saturday, December 23, 2006
O.C. Register: Lender on Orange County Housing
by Calculated Risk on 12/23/2006 06:11:00 PM
From Lansner on Real Estate in the OC Register: Lender Norris eyeballs O.C. housing '07
We'll start with lender/investor Bruce Norris of The Norris Group. He's followed Southern California real estate for seemingly ever. He deftly called the beginning of the turn-of-the-century housing rally but now he has turned bearish. Let's see what he's thinking ...Excerpts:
Us: What's your outlook for the local housing market for 2007?
Bruce: Orange County prices down 5 percent.
...
Us: What might be the housing surprise we'll be talking about a year from now?
Bruce: The greatest year-over-price year decline since the Great Depression, nationally.
Friday, December 22, 2006
Year End Predictions
by Calculated Risk on 12/22/2006 06:07:00 PM
Last year I tried to predict the top economic stories of 2006. I intentionally went "out on a limb", and I definitely missed a few. I'll be doing it again this year. Recession or no recession? I guess I'll have to make a call next week!
But first, a quick review - here are some stories that I thought would not be big in '06:
Energy Prices: I expect oil prices to stabilize or decline next year. WTI spot prices closed at $59.96 today.
I missed this one big time. WTI spot prices are $62+ today - that doesn't seem too far off, but I completely missed the huge price increase in the middle of '06.
Bush Economic proposals: I think the Bush Administration will be shackled by scandals and Iraq, so I don't expect any major new proposals. I hope I'm wrong about Iraq.
Got that one right. I wish I was wrong about Iraq.
Trade Deficit / Current Account Deficit: I could be wildly wrong here too, but I think the trade deficit will stabilize or even decline slightly next year. Note: I clarified this one - I expected the deficit to stabilize at the Q4 level - clearly the deficit was going to increase in '06.
Looks pretty good. The trade deficit appears to have stabilized at about the level of Q4 2005. However, the current account deficit is still climbing.
The Budget Deficit: Although I expect the General Fund deficit to grow to around $600 Billion in 2006, I don't think it will become a huge story until '07 or '08.
This was more of a story than I expected, mainly because the General Fund deficit declined to $434 Billion from $470 Billion in fiscal 2005. I still think the huge story will be in the coming years.
And here are the stories I thought would be big in '06:
5) The End of the Greenspan Era I think Dr. Bernanke will face a significant challenge in '06, perhaps by one the following top stories - perhaps by something completely unexpected. Stephen Roach recently wrote:
"Alan Greenspan faced a stock-market crash two months after he took over in August 1987. Paul Volcker had to cope with a rout in the bond market three months after he became chairman in August 1979. G. William Miller was challenged immediately by a dollar crisis in the spring of 1978. For Arthur Burns, it was the inflation bogie in the early 1970s."Missed that one: Bernanke had a crisis free year.
4) Housing Slowdown In my opinion, the Housing Bubble was the top economic story of 2005, but I expect the slowdown to be a form of Chinese water torture. Sales for both existing and new homes will probably fall next year from the records set in 2005. And median prices will probably increase slightly, with declines in the more "heated markets".
Pretty close.
3) Pension Blowup / Major Bankruptcy Of course I am thinking GM, but maybe it will be another major corporation.
Another complete whiff.
2) Slowing Economy If the US and the World economies slide into recession, this will be the top story next year. I still think it is too early to call, but I do think economic growth will slow substantially next year.
Slow? Yes. Slow substantially? We will need to see the Q4 GDP numbers - right now I think Q4 GDP will be around 2%.
1) Interest Rates ... like many observers, I expect the Fed to start lowering rates later next year as the economy slows. But here is the surprise, I think long rates will start to rise when the Fed starts cutting the Fed Funds rate.
I clearly missed the timing of the rate cut, but this prediction was that long rates would rise as the Fed cut rates. We will have to wait to see if that happens.
Here is how the AP ranked the top 2006 stories.
Fed: Mortgage Obligation Ratio at Record Levels in Q3
by Calculated Risk on 12/22/2006 02:45:00 PM
The Federal Reserve released the "Household Debt Service and Financial Obligations Ratios" for Q3 2006 today.
DEFINITIONS: The household debt service ratio (DSR) is an estimate of the ratio of debt payments to disposable personal income. Debt payments consist of the estimated required payments on outstanding mortgage and consumer debt.The owner FOR (Financial Obligation Ratio) was 18.16% in Q3 '06, off slightly from the revised 18.17% for Q2 '06 (Q2 was originally reported at 18.06%)
The financial obligations ratio (FOR) adds automobile lease payments, rental payments on tenant-occupied property, homeowners' insurance, and property tax payments to the debt service ratio.
The mortgage portion of the FOR set a new record at 11.68%, up slightly from 11.65% in Q2 '06. (Q2 was originally 11.60%)
The household DSR (Debt Service ratio) was off slightly at 14.49%, from 14.51% in Q2 '06. (Q2 was originally 14.40%)
Note: All of the estimates for Q2 were revised upwards, otherwise these would have been new records across the board.
 Click on graph for larger image.
With relatively low mortgage rates, one might expect the mortgage portion of the FOR to be lower than previous periods, not at record high levels.
Note that the previous housing bubble peaked with the mortgage portion of the FOR at 10.38%.
Core PCE and Savings Rate
by Calculated Risk on 12/22/2006 12:08:00 PM
The BEA reports for November:
Personal income increased $33.8 billion, or 0.3 percent, and disposable personal income (DPI) increased $27.0 billion, or 0.3 percent, in November, according to the Bureau of Economic Analysis. Personal consumption expenditures (PCE) increased $50.5 billion, or 0.5 percent.Some things stay the same:
Personal saving as a percentage of disposable personal income was a negative 1.0 percent in November, compared with a negative 0.7 percent in October.The BEA explains:
Saving from current income may be near zero or negative when outlays are financed by borrowing (including borrowing financed through credit cards or home equity loans), by selling investments or other assets, or by using savings from previous periods.But some thing might have changed:
The Fed's favorite measure of the inflation rate - the change in the core PCE price index - was essentially unchanged in November (0.5% annualized), and the trailing six month change was 2.0% - right at the high end of the Fed's assumed target range (2%). Of course this is just one month's data.
The following graph compares the market-based core PCE vs. the Fed Funds rate for the last seven years.

Click on graph for larger image.
This follows the recent benign report on CPI. PPI was a little high, but Kash suggests: Exaggerated Inflation Worries
At this point, I believe a slowing economy is a greater risk than inflation. However the Fed apparently still thinks inflation is the greater risk (see Dr. Duy's: Fed Watch: Where’s That Recession?. Tim concluded:
"... on balance, these things most likely leave policy makers holding steady, with one foot still hovering over the break, not ready to shift to the accelerator."If inflation stays benign, the Fed has their foot on the break even without raising rates.
Thursday, December 21, 2006
Fed's Lacker: Economic Outlook
by Calculated Risk on 12/21/2006 03:41:00 PM
Jeffrey M. Lacker, President, Federal Reserve Bank of Richmond, spoke today on the economic outlook, with several comments on housing.
Since growth clearly has slowed, the question on many people's minds is, "What's next?"This "several month" time frame seems very optimistic.
...
The distinguishing feature of the current transition is the magnitude of the adjustment in the housing market, which comes at the end of what has been an amazing, decade-long run. The homeownership rate increased by 4 full percentage points from 1995 to 2005, and the number of houses built per year increased by 46 percent over that 10-year period.
...
The secular increase in housing demand in recent years was apparently satisfied in many markets by the end of 2005. Nationwide, new home sales have fallen by 22 percent through October of this year. The pipeline of new projects under construction was not scaled back as rapidly, however, and we now have excess inventories of new and existing homes in most localities. Production of new homes will have to undershoot demand for a time in order to work off the backlog. Indeed, new housing starts have fallen 28 percent through November of this year. The inventory overhang that remains suggests that homebuilding will be below demand for several more months.
Looking ahead, there are tentative signs that the demand for housing has stabilized. New home sales have bumped around the 1 million unit annual rate for the last four months, and new purchase mortgage applications have risen over 15 percent in the last seven weeks. If these tentative signs are confirmed by more complete data then new home construction only needs to lag new home sales long enough to work off the current bulge in inventories. In this scenario, I would expect housing starts to realign with sales around the middle of 2007. Should new home demand deteriorate instead, the adjustment could take longer.This is part of the reason the next 6 months are so important - as Lacker noted, residential construction "has shed 110,000 jobs since the peak in February". But there are 400K to 600K residential construction jobs that will probably be lost over the next 6 months.
In any event, the weakness in housing will continue to be a drag on overall economic activity into the first half of next year, with the effect gradually waning as the year progresses. But I seriously doubt it will be enough of a drag to tip the economy into recession.
...
Could weakness in the housing market spillover and weaken consumption spending as well? As residential investment contracts, construction employment will certainly decline. So far, residential construction employment has shed 110,000 jobs since the peak in February. At the same time, however, other segments of the economy have been doing well and overall payrolls actually expanded by 1.2 million jobs. This again reflects the small size of the residential construction sector relative to the overall economy. Although the outlook is for construction employment to continue to weaken for at least several more months, a decline commensurate with the fall-off we've already seen in housing starts still would have only a minor effect on total employment.
It's not surprising that the economy could absorb the 110K jobs lost so far over a ten month period (about 11K jobs per month), but the rate of job losses is about to increase, and increase significantly. Will the economy be able to absorb that level of losses? That is a key question.
As I have said before, consumer spending is largely determined by current and expected future income prospects. I expect the overall job market to continue to expand even after accounting for further job losses in homebuilding, and I expect the tight labor market to continue to generate healthy wage gains. With income prospects looking good for 2007, it seems a pretty safe bet that consumer spending will do well, and again that's by far the largest part of the economy.The consumer has been relying on personal income and borrowing against assets to sustain spending. With prices stable or declining for the most widely held asset (housing) in 2007, will consumers perceive their total income prospects as "looking good"? That is another key question.
Tanta: On Hybrids, Teasers, and Other Mortgage Guidance Problems
by Calculated Risk on 12/21/2006 11:12:00 AM
According to the LA Times, our friends in the mortgage business have once again been asking the regulators to let this cup pass:
A coalition of nine banking and housing groups, including the American Bankers Assn., asked six federal and state bank regulators to abandon the idea of adding so-called hybrid adjustable-rate mortgages, or hybrid ARMs, to guidelines they put forward in September. . . .I haven’t gotten my hands on a copy of either of these letters yet, so I really have no way of knowing for sure if they’re as stupid as the Times reporter makes them sound. But since the question of the “2/28s” keeps coming up in the comments, I thought I’d at least define a few terms as I understand them, in the naïve hope that this might help us move the ball forward about an inch.
Lawmakers and consumer groups have called on regulators to incorporate the mortgages in the guidelines, which banks use to set underwriting and disclosure standards. The guidelines currently apply to interest-only and payment-option adjustable-rate loans. . . .
In a Dec. 7 letter to regulators, six members of the Senate Banking Committee, including incoming Chairman Christopher J. Dodd (D-Conn.), asked that the hybrid mortgages be included because they "have a number of the same risky attributes" as the mortgages already covered by the guidelines.
First of all, a “hybrid ARM” is called a “hybrid” because it is, basically, a cross between a fixed rate and adjustable rate mortgage. Before the early 90s, an “ARM” basically meant a one-year ARM. The initial interest rate was set for one year, and the rate adjusted every year. The only real variations on this theme involved shortening the adjustment frequency: you could get an ARM that adjusted every six months instead of one year.
Around the early 90s, the “hybrid ARM” was introduced. It had an initial period in which the rate was “fixed” that didn’t match the subsequent adjustment frequency: this is the classic 3/1, 5/1, 7/1, and even 10/1 ARM. The whole idea of the hybrid ARM was to provide a kind of medium-range risk/reward tradeoff for borrowers and lenders. With a fixed rate loan, the borrower gets the security of knowing the payment will never rise, with the potential risk that market rates will go down and that secure fixed payment will be expensive relative to market rates. With an old-fashioned one-year ARM, the borrower gets to take advantage of an initial interest rate that is lower than the fixed rate, with the potential for a falling interest rate in the future, at the risk that rates will rise rather than fall. From a credit underwriting perspective, FRMs have always outperformed one-year ARMs by a wide margin, precisely because payment stability always reduces risk. The trouble for a lot of borrowers was that increasing numbers of them didn’t feel the need for 30 years’ worth of interest rate protection, as the average tenure in a home became around 7 years, while occasionally shocking spikes in short-term rates meant that a one-year ARM was too often not enough rate protection. So the hybrid offered the middle way: enough rate protection to more or less match expected loan life, a start rate that was discounted less than a one-year ARM but was still cheaper than a fixed rate, plus the security of not being forced to refinance at the end of the fixed period if things didn’t go as planned and you were still in the home you bought—the other then-popular alternative to the ARM was the fixed-rate balloon, which had a term of five or seven years and then required a lump-sum payment of the remaining balance. With a balloon, you have to either refinance or sell at maturity, and take the refinance costs and potentially much higher market interest rate. A hybrid ARM, on the other hand, just turns into a one-year ARM after the first adjustment, which may not be what you wanted, but it doesn’t force you to do something by its very structure. Whether you are forced by affordability issues is, of course, another matter.
The immediate question these products raised for lenders was how to underwrite them: are they ARMs or FRMs for purposes of determining credit risk? The position taken by the GSEs from the beginning—and also adopted by the mortgage insurers—was that you could treat a hybrid as a FRM for underwriting purposes if its initial fixed period was longer than three years. If it was three years or less, the loan had to be treated as you would a one-year ARM. And that, by the way, meant qualifying the borrower at (usually) the maximum first adjustment rate: if your start rate was 5.00% and the first adjustment cap was 2.00%, then 7.00% was the maximum rate you would face at your first adjustment and thus the rate used to qualify you. The mortgage insurers used the more expensive ARM premiums for these loans, and allowed those with 5-year or greater fixed periods to use FRM premiums. All of this made perfect sense to Tanta at the time, by the way, and still does. All other credit practices being equal, true hybrids (fixed period of 5 years or more) very slightly underperform FRMs, but only by a hair. The 3/1 has always performed only very slightly better than the one-year ARM. Historically speaking, it’s not a dumb place to make the cut.
Then, of course, we had to get creative, adding interest-only periods to the initial fixed rate period, which creates enormous payment shock when and if the loan does reset; moving from a more-or-less standard 5/1 ARM with a 2.00% first adjustment cap to a more-or-less standard 5/1 ARM with a 5.00% first adjustment cap (so that the initial rate could be more reasonably discounted from the fixed, creating the classic “teaser” problem), changing the adjustments from one-year indexed to the treasury to 6-month indexed to the LIBOR, and, worst of all, deciding that the “hybrid” was the perfect product for subprime borrowers. When hybrids hit the subprime market, they not surprisingly mutated a bit, the initial fixed period on the majority of loans shrinking to 2 years with a 6-month reset, often with interest only for two years and a deeply-discounted start rate. This made the “subprime hybrid” an even worse performer than the old one-year “true ARM,” but certain folks continued to delude themselves (and their investors) that the “hybridization” of these products actually improved the risk characteristics, never mind that the loan was less a cross between a FRM and an ARM than it was a high-risk ARM with a single drop of FRM in it two generations ago.
Then there is the “teaser rate” problem. There is no exact or absolute definition of a “teaser” rate. The concept was traditionally applied to a start rate that was so deeply discounted relative to the fully-indexed rate (index plus margin) that its clear purpose was merely to rope in the borrower, and which had a pretty fair chance of creating severe payment shock down the road. The problem is, of course, that almost all ARMs—hybrid or not—are “discounted” relative to something (either the fully-indexed rate or the prevailing 30-year fixed rate). And there’s absolutely nothing wrong with that; in fact, if you the borrower are willing to take the future risks involved in an ARM, you’re getting screwed if your lender doesn’t give up a little yield in the here and now in exchange. The whole reason that the 7/1 and 10/1 ARMs go in and out of fashion isn’t that people wouldn’t like to have them sometimes, it’s that in certain rate environments it’s hard to price them with any real discount to the 30-year fixed, and why take one if you don’t get a rate discount? The point here is that conflating the terms “teaser” and “discounted start rate” is a big problem if you’re talking about regulations designed to combat the use of teaser rates, since if you outlaw any discount of the start rate you just basically increased the credit costs to prime borrowers for whom a 5/1 ARM with reasonable caps is often a great deal.
Of course, you can try to come up with some formula to define the difference between “teaser” and “discounted,” but you’re likely to fall into the silly pit that a lot of regulations have ended up falling into when they do things like this. The better approach—and for once, some regulators seem to have tried it—is not to focus on what makes a rate a “teaser,” but to focus on what makes a teaser a problem: how to calculate the payment used to qualify the borrower for the loan. The idea, in short, is that you can give the borrower any old rate discount you want, as long as you ensure that the borrower can afford the inevitable payment increase when the discounted rate goes away. Here, however, we run into the problem of deciding what is a reasonable time period over which to force the borrower to qualify at his or her current income, and that gets us back to the distinction between the “true” hybrids and the ARMs masquerading as hybrids. It is not obvious to me, at least, that prudence always and everywhere requires a mortgage borrower to qualify for the worst possible mortgage payment she might face in five years while assuming that her income will never increase. It does, however, strike me as prudent that a mortgage borrower should be able to carry the worst possible payment she might face in three years at her current income. Arbitrary? Sure, but you really do need to make a cut somewhere, unless you want to de facto eliminate the true hybrid ARM offering for prime (or even near-prime) borrowers, and why would you want to do that?
So this is why I’m so frustrated about all this noise regarding whether the 2/28 should “count” in the Nontraditional Mortgage Guidance or not. To give the lender lobby its due credit for a minute, they aren’t being as hysterical as they might sound by objecting to any regulation that codifies any and all “hybrid ARMs” as a problem product by definition. In my view, what the Nontraditional Guidance needs to do is just declare a set of rules for when a hybrid is an ARM-hybrid and when it’s a FRM-hybrid, require all ARM-hybrids to be qualified at the maximum interest rate possible at the start of the fourth year of the loan, and require lenders who offer interest-only ARMs to either offer the IO period for at least three years longer than the initial fixed period or qualify the borrower at the amortizing payment. (Going out three years past the adjustment means that you smooth out the payment increases, letting the rate rise over time to fully-indexed before you add in the recast to amortizing payments. The recast can still hurt, but by now you’re six to ten years into the loan, and chances are still reasonable that appreciation and income growth will bail you out if a refi won’t.) Beyond that, simply requiring lenders to chose either a prepayment penalty or a subprime credit score, but not both, would solve most of the 2/28 problem. (Why? Because you can’t afford to give that “teaser” rate to the borrower without throwing in a prepayment penalty to keep the loan from paying off before it adjusts, thereby increasing your expected yield over the life of the loan. If the investor didn’t get the prepayment penalty, the investor would require a more reasonable yield in the first two years.)
The rest of the problem can be solved most practically, in my mind, by mandating risk “classifications” for things like interest only, negative amortization, CLTVs over 90%, 5% first adjustment caps for the 5/1 ARM, stated income, etc. “Classifications” mean that a loan portfolio has to set aside higher loss reserves for loans in certain classes than for others; this costs the portfolio some yield, effectively putting a disincentive to risky lending in front of an institution that can’t afford decent reserves, while letting an institution that is strong enough offer a reasonable number of higher-risk loans. After all, it isn’t just borrowers whose income, stated or verified, can be a bit iffy. I’m all in favor of making the bank verify rather than state its income, and qualify for its loan portfolio based on its actual equity position, collateral quality, and generally responsible debt management behavior. But I’m old-fashioned enough to think that corporations shouldn’t necessarily get a better deal than consumers get.
MarketWatch: "Housing to Stabilize in '07"
by Calculated Risk on 12/21/2006 01:27:00 AM
From MarketWatch: Housing market got buffeted in 2006, expected to stabilize in 2007
... unlike some people had expected, the switch didn't follow the deafening "pop" of a massive real estate bubble.And there is plenty more "don't worry, be happy" talk in the story. But the problem with the story line is the bust was worse than most observers expected:
...the correction wasn't as harsh as some had feared. In fact, the year as a whole might even have been described as "healthy" if the country's perspective hadn't been skewed by the boom of the past few years, said John McIlwain, senior fellow for housing at the Urban Land Institute. The market is still "well within long-term norms," he said.
"I think the story of the year is the bubble that wasn't," McIlwain said. "Instead of a bubble busting, so far it has been a healthy correction."
"The housing market, as you know, it has been hit, I think, harder than most of us had expected."
Edward Lazear, Q&A Nov 21, 2006, chairman of the White House's Council of Economic Advisers
"I guess we are a bit surprised at how fast this has unraveled," said [Tom Zimmerman, head of ABS research for UBS]. Nov 22, 2006 on Subprime mortgages.
"Fifteen percent is pretty much in the bag for Orange County in 2006," [Gary Watts] says. "It's impossible for prices to go down this year."Note that year-over-year prices in Orange County were flat in the most recent survey, and will probably be down for the year.
Gary Watts,Feb, 2006, Orange County Broker
I'm not sure who expected housing to "pop" in 2006. The author doesn't quote anyone.
However, housing "bubbles" typically do not "pop", rather prices deflate slowly in real terms, over several years. As I've noted before, real estate prices display strong persistence and are sticky downward. Sellers tend to want a price close to recent sales in their neighborhood, and buyers, sensing prices are declining, will wait for even lower prices.
This means real estate markets do not clear immediately, and what we usually observe first is a drop in transaction volumes. That is what happened in 2006. And that is about what I predicted:
In my opinion, the Housing Bubble was the top economic story of 2005, but I expect the slowdown to be a form of Chinese water torture. Sales for both existing and new homes will probably fall next year from the records set in 2005. And median prices will probably increase slightly, with declines in the more "heated markets".Now comes 2007, and I expect falling prices, falling transactions, falling starts, falling housing related employment, falling home equity extraction - lots of falling - but not everything will be falling: foreclosures will be rising.
I wonder how this writer will characterize the surprises of 2007?
FedEX Outlook
by Calculated Risk on 12/21/2006 12:58:00 AM
From AP: FedEx 3Q Outlook Overshadows 2Q Earnings
... the company said it expected lower third-quarter earnings than last year, largely due to a sluggish U.S. economy and fuel bills.But international markets are doing well:
...
"We believe FedEx is beginning to see the impact of a slowing economy and as such, management is tempering expectations for the second half of the year," analyst Art Hatfield said in a report for Morgan Keegan.
"They said themselves that the domestic economy is showing signs of weakness," Broughton said. "FedEx's international business continues to grow and in a down-volume domestic environment, they produced the best operating margins they've ever produced."
...
In a conference call with analysts, FedEx founder and chief executive Frederick W. Smith said FedEx expects "steady performance" for the fiscal year ending May 31 largely because of a "healthy global economy led by continued strong growth in Asia."
But Smith also acknowledged he expects a "somewhat slower growth in the U.S. economy related to adjustments in housing and manufacturing sectors."
Wednesday, December 20, 2006
NAR: Concerned Over Foreclosures
by Calculated Risk on 12/20/2006 12:24:00 AM
The National Association of Realtors (NAR) joined with the Center for Responsible Lending (CRL) expressing concern about foreclosure rates: NAR Concerned Over Rapid Increase in Foreclosure Rates.
See CRL Report: 2.2 Million Subprime Borrowers Face Foreclosure
From NAR:
The National Association of Realtors(R) said it is concerned over the rising rate of defaults and foreclosures occurring in many areas around the country, and many Realtors(R) believe that some families don't understand the risks of taking out "exotic" mortgages.
In a conference call today with the Center for Responsible Lending and the Leadership Conference on Civil Rights, NAR President Pat Vredevoogd Combs urged consumers to make sure they understand the risks and rewards of all types of mortgages before they make a decision on a loan. ...
Foreclosures are not only a disaster for families but also for communities. Problematic loans are often made in concentrated areas, and high foreclosure rates of single-family homes can seriously threaten a neighborhood's stability and a community's well being. "Foreclosures can lead to high vacancy rates, which in turn, can cause all homes in the neighborhood to lose value," said Combs.
MBA: Mortgage Applications Decrease
by Calculated Risk on 12/20/2006 12:10:00 AM
The Mortgage Bankers Association (MBA) reports: Mortgage Applications Decrease in This Week’s Survey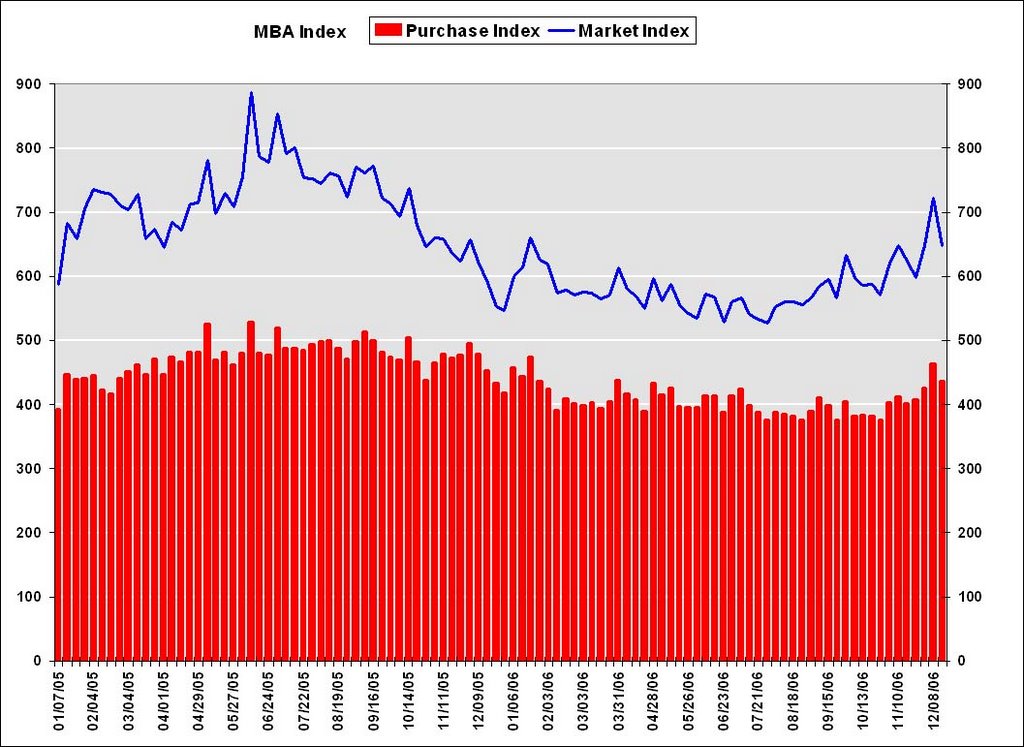 Click on graph for larger image.
The Market Composite Index, a measure of mortgage loan application volume, was 647.6, a decrease of 10.2 percent on a seasonally adjusted basis from 721.2 one week earlier. On an unadjusted basis, the Index decreased 11.6 percent compared with the previous week and was up 13.9 percent compared with the same week one year earlier.Mortgage rates increased:
The seasonally adjusted Refinance Index decreased by 14.6 percent to 1968.8 from 2304.4 the previous week and the Purchase Index decreased by 5.9 percent to 436.5 from 463.8 one week earlier.
The average contract interest rate for 30-year fixed-rate mortgages increased to 6.10 from 6.02 percent ...
The average contract interest rate for one-year ARMs increased to 5.82 percent from 5.76 ...
 The second graph shows the Purchase Index and the 4 and 12 week moving averages since January 2002. The four week moving average is up 2.1 percent to 433.4 from 424.6 for the Purchase Index.
The refinance share of mortgage activity decreased to 50.8 percent of total applications from 52.6 percent the previous week. The adjustable-rate mortgage (ARM) share of activity decreased to 23.6 from 24.9 percent of total applications from the previous week. The ARM share is at its lowest level since October 2003.Last week Bank of America commented on the recent surge in refinance activity:
"Strong MBA application activity ... We think its just bringing forward ’07 refi’s and see little help for riskier credits."
Tuesday, December 19, 2006
Report: 2.2 Million Subprime Borrowers Face Foreclosure
by Calculated Risk on 12/19/2006 04:54:00 PM
The Center for Responsible Lending has released a new report: Losing Ground: Foreclosures in the Subprime Market and Their Cost to Homeowners.
"... foreclosure rates will increase significantly in many markets as housing appreciation slows or reverses. As a result, we project that 2.2 million borrowers will lose their homes ...
...
We project that one out of five (19 percent) subprime mortgages originated during the past two years will end in foreclosure. This rate is nearly double the projected rate of subprime loans made in 2002, and it exceeds the worst foreclosure experience in the modern mortgage market, which occurred during the “Oil Patch” disaster of the 1980s."
Housing: Starts and Completions
by Calculated Risk on 12/19/2006 08:35:00 AM
The Census Bureau reports on housing Permits, Starts and Completions. Permits are still falling:
Privately-owned housing units authorized by building permits in November were at a seasonally adjusted annual rate of 1,506,000. This is 3.0 percent below the revised October rate of 1,553,000 and is 31.3 percent below the November 2005 estimate of 2,191,000.Starts rebounded:
Privately-owned housing starts in November were at a seasonally adjusted annual rate of 1,588,000. This is 6.7 percent above the revised October estimate of 1,488,000, but is 25.5 percent below the November 2005 rate of 2,131,000.And Completions are falling, but still just below record levels:
Privately-owned housing completions in November were at a seasonally adjusted annual rate of 1,915,000. This is 0.2 percent below the revised October estimate of 1,919,000, but is 0.3 percent above the November 2005 rate of 1,909,000.
 Click on graph for larger image.
The first graph shows Starts vs. Completions.
Starts have fallen "off a cliff", but completions have just started to fall.
This graph shows starts, completions and residential construction employment. (starts are shifted 6 months into the future). Completions and residential construction employment are highly correlated, and Completions lag Starts by about 6 months.
Based on historical correlations, it is reasonable to expect Completions and residential construction employment to follow Starts "off the cliff". This would indicate the loss of 400K to 600K residential construction employment jobs over the next 6 months.
Monday, December 18, 2006
Hovnanian: High Cancellations, Falling Prices
by Calculated Risk on 12/18/2006 06:02:00 PM
Hovnanian Enterprises Reports:
"We did not anticipate the suddenness or magnitude of the fall in pricing that occurred this year in many of our communities. Our profitability and the pace of new home sales in our markets continues to be adversely impacted by high contract cancellation rates, increases in the number of resale listings and increases in the number of new homes available for sale," Mr. Hovnanian said. The Company's contract cancellation rate for the fourth quarter was 35%, compared with 25% in the fourth quarter of 2005 and a 33% rate reported in the third quarter of fiscal 2006.On impairments:
emphasis added
"In the fourth quarter, we decided to walk away from $141 million in land deposits and predevelopment costs and took impairment charges of $174 million," said J. Larry Sorsby, Executive Vice President and Chief Financial Officer.And on 2007:
"Although we are concerned with the uncertainty currently evident in housing markets, we are providing initial guidance for fiscal 2007, based on our standard practice of assuming that our sales pace and pricing in each of our communities remains as it is today and that market conditions do not deteriorate further," Mr. Sorsby continued. "On that basis, assuming that the economy remains reasonably healthy and mortgage rates remain stable, we are projecting fiscal 2007 earnings between $1.50 to $2.00 per fully diluted common share on 16,000 to 18,000 home deliveries ... We believe that the overall U.S. housing market may hit the bottom in the first half of 2007. However, the housing market is likely to bounce along the bottom for several quarters before pricing and sales pace improves."

NAHB: Builder Confidence Declines in December
by Calculated Risk on 12/18/2006 01:12:00 PM
From NAHB: Builder Confidence Holding Steady in December
At 32 for the present month, the overall HMI is down a single point from November but remains above the recent low of 30 in September.
 Click on graph for larger image.
The only component index to register a decline in December was the one measuring traffic of prospective buyers which, after a three-point jump last month, returned to its October level of 23. The component gauging current single-family home sales remained even at 33, up slightly from its recent low, while the component gauging sales expectations for the next six months rose three points to 48 – its third consecutive monthly gain.
Regionally, the HMI posted the biggest gain this time around in the Midwest, which has shown the greatest weakness in this measure for many months. That region posted a 7-point gain to 22 on the confidence scale, while the Northeast was unchanged at 37, the South dropped a point to 39 and the West declined four points to 31.
Sunday, December 17, 2006
What year is it?
by Calculated Risk on 12/17/2006 11:59:00 PM
Dr. Christine Chmura, president and chief economist at Chmura Economics & Analytics, says the economic pessimists aren't looking at the complete picture. She writes in the Richmond Times-Dispatch: Consumer debt high, but there's more to the story.
"...the Fed reports that household debt service payment (interest and principal) of homeowner mortgages relative to disposable personal income was 11.6 percent in the second quarter of 2007, the highest ratio on record since the data were first calculated in 1980.But Chmura says:
Combining mortgage debt, consumer debt and other financial obligations -- auto leases, rental payments, homeowners insurance, property-tax payments gives the broadest view of debt for households.
Once again the Fed reports that this debt-service ratio for households is the highest on record: 14.4 percent of disposable personal income.
Couple this information about consumer debt with a significant slowdown in home-price acceleration, and pessimists point toward a soon-to-occur recession."
"[The pessimists] haven't looked at the complete picture.Never mind that Chmura mixes flows with stocks, more importantly she could have written this piece in mid-1990 - just as the early '90s recession started.
A full balance sheet reflects assets as well as liabilities. As of the third quarter of 2006, household assets were at a record $67.058 trillion. Rising values in real estate and equities contributed to the increase.
More important, net worth hit a record $54.063 trillion during the same quarter.
So ... when the bills roll in over the next month, just remind yourself that the consumer engine that fueled an expansion still has the ability to support more spending and keep the economy robust."
Chmura notes that the mortgage portion of the homeowners financial obligation ratio (FOR) was a record 11.6% in Q2 2006. In Q2 1990, the ratio was a then record 10.9%. The Q2 2006 debt service ratio (DSR) was a record 14.4%; in Q2 1990 it was a near record 11.96%. And in Q2 1990, pessimists were also concerned about "a significant slowdown in home-price acceleration".
But if someone just looked at the household balance sheet in Q2 1990, everything looked great (Fed: Flow of Funds). Assets were a record $23.7 Trillion and net worth hit a record $20.1 Trillion in Q2 1990.
And then the recession started ...
Saturday, December 16, 2006
Silent Night
by Calculated Risk on 12/16/2006 12:04:00 AM
A short clip from the CSI: New York episode "Silent Night" that aired this week. You know who played a skating star (a stretch!) whose best friend is murdered. This is the ending sequence of the episode:
Friday, December 15, 2006
WSJ: The old rules don't apply
by Calculated Risk on 12/15/2006 06:39:00 PM
The WSJ suggests:
"... the U.S. central bank and much of Wall Street are now betting that the old rules don't apply, and that a recession next year, while possible, is unlikely."And the WSJ quotes Dr. Leamer:
"This time will be different," Ed Leamer, who heads the forecasting center at the University of California at Los Angeles's Anderson School of Management, predicts in a report. "This time the problems in housing will stay in housing." It's a prediction, he admits, that "keeps us up at night."Will this time be different? Will the problems in housing stay in housing? Or will the problems spread to the general economy?
A Citigroup research note on retailers this morning starts with:
"We have a neutral outlook on the ... retailers in our coverage universe ..."And concludes in BOLD:
"We are keeping a close watch on the housing market as we progress through 2H06."Obviously asking: Will the problems in housing stay in housing?
Current data, like the better than expected November retail numbers (although Q4 is still on track to have the weakest nominal retail growth since the 2001 recession), indicate the housing bust might not be significantly impacting retail sales yet. Other data, such as from trucking company YRC Worldwide, are not as comforting:
"... the economy has slowed significantly in the fourth quarter, resulting in lower volumes than we anticipated across all of our asset-based business units," stated Bill Zollars, Chairman, President and CEO of YRC Worldwide.... Fourth quarter tonnage is projected to be lower than 2005 by a mid-single digit percentage for each business unit.And more:
[Jordan Alliger, an analyst at Deutsche Bank] cited perceived risks to the economy in 2007, which could further weaken the unusually sluggish demand truckers have witnessed in the second half of this year.But the key isn't what is happening right now; the key is what happens early next year. (Note: I know I've been repeating this timing for some time - but it is almost here!).
...
"Should the peak season volume malaise extend deeper into 2007 and call into question the so-called 'soft-landing' economic scenario, we could yet prove far too conservative with our newly revised down forecasts," the analyst wrote.
Justin Yagerman, an analyst at Wachovia Capital Markets, said the soft freight demand raises concern about the health of the economy.
"Conversations with carriers have shown no indication of improving economic forces as freight demands remain muted," Yagerman said in a research note on Wednesday.
Residential construction layoffs will be significant soon (probably starting this month or in January). Home equity extraction has been falling rapidly. Nonresidential construction might have peaked. Foreclosures are rising and will probably be at, or near, record levels in 2007 (at least in California). And issues with mortgage credit quality are finally coming to light.
We will find out soon if the "problems in housing will stay in housing". Right now I'm not sanguine. And I can understand why Dr. Leamer has trouble sleeping.
DataQuick: California Sales Lowest Since 1998
by Calculated Risk on 12/15/2006 02:59:00 PM
DataQuick reports: California November Home Sales Click on graph for larger image.
A total of 39,200 new and resale houses and condos were sold statewide last month. That's down 8.3 percent from 42,750 for October and down 23.5 percent from a 51,250 for November 2005.Although some areas are already seeing YoY nominal price declines (Bay Area, San Diego, Ventura), the median YoY price in California increased slightly.
Last month's sales made for the slowest November since 1998 when 37,928 homes were sold.
The median price paid for a home last month was $469,000. That was up 0.4 percent from October's $467,000, and up 2.4 percent from $458,000 for November a year ago.
Tanta: Let Slip the Dogs of Hell
by Calculated Risk on 12/15/2006 10:26:00 AM
I still haven’t gotten over the fact that there’s a “capital management” group out there having named itself “Cerberus”. Those of you who were not asleep in Miss Buttkicker’s Intro to Western Civ will recognize Cerberus; the rest of you may have picked up the mythological fix from its reprise as “Fluffy” in the first Harry Potter novel. Wherever you get your culture, Cerberus is the three-headed dog who guards the gates of Hell. It takes three heads to do that, of course, because it’s never clear, in theology or finance, whether the idea is to keep the righteous from falling into the pit or the demons from escaping out of it (the third head is busy meeting with the regulators). Cerberus is relevant not just because it supplies me with today’s metaphor, but because it was the Biggest Dog of three (including Citigroup and Aozora, a Japanese bank) who in April bought a 51% stake in GMAC’s mega-mortgage operation, GM having, of course, once been renowned as one of the Big Three Automakers until it became one of the Big Three Financing Outfits With A Sideline In Cars. I tried to find a link for you to Aozora Bank’s announcement of the purchase, but the only press release I could find for that day involved the loss of customer data. They must have been so busy letting GMAC into the underworld that the dog head keeping the deposit tickets from getting out got distracted.
The third Big Dog with a new stake in GMAC is Citigroup, who sent out a cute “Industry Note” on 12/13/06 on the subject of the coming consolidation in the mortgage biz. It so happens that I was doing some heavy drugs on the 13th, but apparently I wasn’t the only one (I, on the other hand, am getting over it). The thing I really like about the Citi note is that everything comes in threes:
Meanwhile, the [mortgage] industry is facing several ‘hot–button’ issues, including:I hate to make you wait, so here’s the punchline:
• increased regulatory scrutiny of exotic mortgages and option adjustable rate mortgages (option ARMs),
• resetting rates on hybrids,
• deteriorating credit on subprime and Alt A mortgages.
Key questions for investors relate to how these issues influence volume, margins and credit going forward:
• Will the recent declines in originations continue, especially given higher long-term rates and relatively lower purchase mortgages?
• Will margins continue to contract, as competition for shrinking volumes is intense, and several players make apparently desperate efforts to keep activity in-line with recently beefed-up capacity?
• Will credit become more of an issue as ARM rates reset higher and consumers feel the pressure of higher credit card payments and energy costs?
We think the answers to these questions are, for the most part, “No.” . . .OK, so there was slightly more detail to that answer. As in, there are three reasons why Citi thinks the mortgage origination side will “rationalize” in 2007:
1. First, we expect a continued market share shift away from the industry’s weaker players, toward those with dominant scale and diverse and flexible production channels (i.e., retail, wholesale, and correspondent).Now, I’m just a Little Mortgage Weenie, not a Big Finance Dog, but bear with me while I ask some stupid questions. Like: how do the Big Dogs maintain “diverse and flexible production channels” (i.e., little mortgage banker Puppies to sell you correspondent business and little broker Puppies to sell you wholesale business) when “market share currently held by top-tier players” expands to two-thirds (meaning less diverse off-load strategies for the Little Puppies in the “production channels,” putting them at further pipeline/counterparty risk unless they become Bigger Puppies, which makes them competitors instead of “channels,”), while at the same time watching some of the Little Puppies (in whom the Big Dogs have a major equity stake) crawl under the porch to die? I know Citi doesn’t seem to have noticed that the “increased regulatory scrutiny” is not just of “products” but of “wholesale operational/management controls,” but I did. Anyway,
2. Second, we look for further industry consolidation, likely driven by the pressures of market forces (lower volumes and margins) on second- and third-tier players. The market share currently held by top-tier players (47% held by the top five originators) should expand toward two-thirds and beyond over the foreseeable future.
3. Third, we think the ultimate failure and/or closure of certain weaker market participants is a distinct possibility - given the changing economics of mortgage production and securitization sales during the current post-refinancing cycle. While the timing of such potentially market-disruptive failures/closures is difficult to predict, we believe the most likely casualties will be those players that lack the necessary scale efficiencies and flexibility to adjust to an increasingly competitive environment.
In fact, several mortgage industry deals have recently emerged, as a few Wall Street firms have shown their increased interest. Notable transactions include Morgan Stanley’s agreement to acquire Saxon (for $706 million), Merrill Lynch’s agreement to buy NCC’s First Franklin (for $1.3 billion), and Bear Stearns’ agreement to buy the mortgage unit of ECC Capital Corp (for $26 million). In addition, a few large monoline mortgage players have either announced plans to sell or are pursuing strategic options, including ACC Capital Holdings’ search for a possible buyer for Ameriquest, H&R Block’s announced exploration of strategic options for its Option One mortgage unit, and ABN AMRO’s recently disclosed decision to put its mortgage business on the block. Finally, the recent unceremonious closure of Ownit Mortgage, which was apparently unable to find a prospective merger partner, seems likely to be the first of potentially many large mortgage operations that may be shuttered due to the industry’s current excess capacity.Ownit’s “unceremonious” problem was it couldn’t find a merger partner? According to Marketwatch, “Ownit was formed in 2003 when Merrill Lynch, Interthinx, Mindbox, C-BASS, Litton Loan Services and other ‘key industry vendors’ formed a strategic alliance with [Bill] Dallas to buy a wholesale mortgage company called Oakmont Mortgage.” Bill Dallas used to run Little Subprime Dog First Franklin until it found a home with a Medium Respectable Bank Dog National City, who just offered to unload it on Big Wall Street Dog Merrill Lynch, who is rumored to be a 20% stakeholder in Ownit (Dead Puppy). As far as I can tell, the “unceremonious closure” of Ownit came about when Merrill, and possibly some other bankers, shut off Ownit’s warehouse line of credit without prior notice, preventing them from funding any more worthless loans. Well, you could call that an “excess capacity” problem. You could say they just needed a “merger partner.” You could smoke dope with all three of your heads.
(Sidetrack: Citi notes that PHH is a possible Medium Dog merger/acquisition target. I am old enough to have spent years trying to teach myself to stop calling PHH PHH after it became Cendant. I have only just barely gotten used to calling it PHH again after Cendant’s exciting descent into the Underworld. Now this old dog has to learn a new trick? I have no idea why I would bother; I’m beginning to doubt that any of these dogs will come when called anyway.)
I bring all this up not just to stick it to Citicorp, but because we’ve all been asking the question lately of who will be the bagholder when the exotic/subprime mortgage problem finds a home. We have noted in our discussions that credit risk can move in two directions: the wholesaler takes it off the originator and the bond investor takes it off the wholesaler/issuer with the helpful assistance of protection sellers in the hedge fund credit-swap market, but when the “DETOUR” signs pop up, the bond investor can work really hard on forcing it back to the wholesaler/issuer, who can try to put it back to the originator, who gets to try to recover something in a foreclosure sale. If the originator has any financial strength left to buy loans back with, that is; see the sad stories of Ownit, Option One, Fremont, New Century, etc. The “disintermediation” of the mortgage origination side keeps the Big Dogs “flexible,” meaning able to withstand cyclical downturns in the business, but the burning desire on the Street for “vertical integration” seems to mean an endless appetite for erasing that flexibility by buying up the originators of junk, so that they will have paid what one assumes is real money for the privilege of buying back their own loans right at the time they get the “flexibility” of not buying any more of them from the “intermediaries.” If you thought the only thing that would stop the circle jerk of risk was putting some credit and pricing discipline into the game, I guess you’re just a weenie like me. Anyone who can make sense of this is free to set me straight. And if the answer has “sorting socks” in it, don’t bother. I’ve tried that.
There’s some more interesting stuff in the Citi note that I’ll try to share with you later. Let me just leave you with this last bit:
Over the near-to intermediate-term (next 12-18 months), we believe mortgage industry rationalization will be driven by cyclical market forces – including lower originations, weaker margins, and deteriorating credit. We also expect recent secular shifts to influence consolidation next year, including new stricter regulatory oversight of “nontraditional” products, expanding advantages of diversification and economies of scale, and increased demand by Wall Street firms for the “raw materials” (manufacturing and servicing) necessary to vertically integrate the mortgage business.Am I too old to understand what the term “secular” means these days, or do I just not have enough heads? Or maybe this is all about theology, not finance, and “secular” just means whatever is in Hell next year. Thank Heaven someone’s guarding the gates thereof: a hedge fund.
Thursday, December 14, 2006
Has Nonresidential Construction Peaked?
by Calculated Risk on 12/14/2006 09:10:00 PM
Most of my focus has been on residential construction and the impending residential construction layoffs. Now is probably the time to start looking for declines in nonresidential construction.
Historically nonresidential investment (including nonresidential construction) has trailed residential investment by about 3 to 5 quarters. Since residential construction spending peaked in December 2005, and residential construction employment peaked in February 2006, it is about time for nonresidential construction to peak - if spending and employment follow the common historical patterns (note: there have been a few exceptions). Click on graph for larger image.
The first graph shows seasonally adjusted private employment for both residential and nonresidential construction. Note that the graph does not start at zero to better show the changes in employment. Source: BLS.
Residential construction employment is clearly trending down, and is probably about to fall "off the cliff". But look at nonresidential construction employment: it is too early to say for sure, but it appears employment might have peaked. Construction spending shows a similar pattern. Private residential construction spending peaked in December 2005, and it appears all other construction spending (public and private nonresidential) might have peaked in August. Source: Census Bureau.
It is early, and these small changes might be normal monthly noise, but since the historical pattern suggests nonresidential construction will probably start declining soon, this might be the first evidence that nonresidential construction has peaked.
DataQuick: Bay Area home prices decline, sales at five-year low
by Calculated Risk on 12/14/2006 01:22:00 PM
DataQuick reports: Bay Area home prices decline, sales at five-year low
Bay Area home prices dipped below year-ago levels in November for the second time in three months as sales held steady at a five-year low, a real estate information service reported.Update: chart added.

The median price paid for a home in the nine-county Bay Area was $616,000 in November. That was 0.3 percent higher than $614,000 in October but down 1.4 percent from $625,000 in November last year, according to DataQuick Information Systems.
Last month's year-over-year decline was the steepest since prices fell 2.1 percent in February 2002.
| Bay Area California Median Home Prices | ||||
| Area | Nov '04 | Nov '05 | Nov '06 | Pct Change |
| Alameda | $500K | $587K | $581K | -1.0% |
| Contra Costa | $474K | $589K | $562K | -4.6% |
| Marin | $739K | $809K | $841K | 4.0% |
| Napa | $535K | $605K | $596K | -1.5% |
| San Francisco | $697K | $749K | $754K | 0.7% |
| San Mateo | $664K | $733K | $726K | -1.0% |
| Santa Clara | $560K | $653K | $665K | 1.8% |
| Solano | $400K | $490K | $446K | -9.0% |
| Sonoma | $472K | $574K | $530K | -7.7% |
| Bay Area | $533K | $625K | $616K | -1.4% |
I added the November 2004 median prices to give a two year perspective on prices.
A total of 7,204 new and resale houses and condos sold in the Bay Area last month. That was down 9.7 percent from 7,979 sales in October, and down 25.9 percent from 9,717 in November last year. A decline from October to November is normal for the season.
Last month's sales count was the lowest for any November since 2001, when 6,644 homes sold. Since 1988, November sales have ranged from 5,579 in 1994 to 10,897 in 2004.
| Bay Area California Homes Sold | ||||
| Area | Nov '04 | Nov '05 | Nov '06 | Pct Change |
| Alameda | 2,251 | 2,009 | 1,441 | -28.3% |
| Contra Costa | 2,179 | 1,961 | 1,406 | -28.3% |
| Marin | 413 | 361 | 268 | -25.8% |
| Napa | 221 | 183 | 125 | -31.7% |
| San Francisco | 616 | 594 | 441 | -25.8% |
| San Mateo | 920 | 756 | 581 | -23.1% |
| Santa Clara | 2,624 | 2,394 | 1,846 | -22.9% |
| Solano | 918 | 774 | 565 | -27.0% |
| Sonoma | 755 | 685 | 531 | -22.5% |
| Bay Area | 10,897 | 9,717 | 7,204 | -25.9% |

In Memoriam: Doris "Tanta" Dungey


| Privacy Policy |
| Copyright © 2007 - 2025 CR4RE LLC |
| Excerpts NOT allowed on x.com |