by Calculated Risk on 3/19/2006 11:30:00 PM
Sunday, March 19, 2006
New Home Sales and Recessions
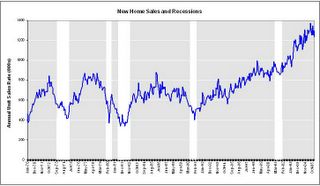
This is just a reminder of the historical relationship between falling New Home Sales (units) and recessions.
Click on graph for larger image.
The white columns are economic recessions as defined by NBER.
For consumer led recessions (all but the most recent recession in 2001), New Home Sales were falling prior to the onset of the recession. It appears that New Home Sales peaked last year and it would be concerning if they fell 20% or more from the most recent peak (to below 1.05 million units). New Home Sales for February will be released on Friday and are expected to be around 1.2 million units (SA, annual rate). It is also important to note that unit volumes have not fallen very far from the peak of 2005.
This doesn't imply a cause and effect relationship, but it is something to watch. If New Home Sales can stay above 1.1 million or so that probably increases the probabilities of a soft landing (just slower growth), as opposed to a hard landing (a recession).


