by Calculated Risk on 8/02/2005 11:36:00 AM
Tuesday, August 02, 2005
Housing: Mortgage Rates
UPDATE: See graph at bottom.
Mortgage rates bottomed in May 2003. 
Click on graph for larger image.
Since May 2003 the 30 year fixed rate has been steady and the 1 Year ARM starter rate has risen almost 100 bps.
A couple of points: We haven't seen a substantial increase in rates yet.
Second, in the less than two years since rates bottomed, house prices have continued to rise.
Percent Increase since Q2 2003 (through Q1 2005 according to OFHEO):
California 37%
Florida 29%
Nationwide 18%
This raises some questions:
1) Why have house prices continued to rise?
2) Have homebuyers migrated from fixed instruments to ARMs to afford homes?
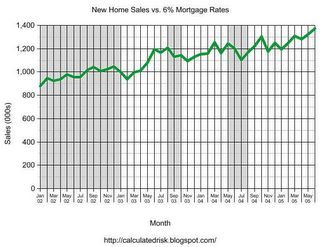
3) Did transaction volumes fall when the 30 year fixed moved above 6% in late summer '03 and mid-summer '04?
To try to address the third question, here is a graph of New Home Sales, Seasonally adjusted since Jan 2002. When the 30 year fixed rate was above 6% is shaded in gray.
During the last two years, it appears that when fixed rates rose above ~6%, New Home Sales faltered. Many buyers just switched to ARMs, but there are probably some buyers that insisted on the insurance of a fixed rate loan. This might be of interest since the 30 year rate is closing in on 6% again.


