 RSS Feed
 by Calculated Risk on 9/24/2010 01:31:00 PM
Friday, September 24, 2010
Home Sales: Distressing Gap
By request, here is an update - this graph shows existing home sales (left axis) and new home sales (right axis) through August. This graph starts in 1994, but the relationship has been fairly steady back to the '60s. Then along came the housing bubble and bust, and the "distressing gap" appeared (due partially to distressed sales).
Note: it is important to note that existing home sales are counted when transaction are closed, and new home sales are counted when contracts are signed. So the timing of sales is different.
 Click on graph for larger image in new window.
Initially the gap was caused by the flood of distressed sales. This kept existing home sales elevated, and depressed new home sales since builders couldn't compete with the low prices of all the foreclosed properties.
The two spikes in existing home sales were due primarily to the first time homebuyer tax credit (the initial credit last year, followed by the extension to April 30th / close by June 30th). There were also two smaller bumps for new home sales related to the tax credit.
Since new home sales are reported when contracts are signed, the 2nd spike for new home sales was in April and then sales collapsed in May. The 2nd spike for existing home sales was in May and June, and then existing home sales collapsed in July.
I expect that eventually this gap will be closed. However that will only happen after the huge overhang of existing inventory (especially distressed inventory) is significantly reduced.
New Home Sales August 2010 (Repeat with graphs)
by Calculated Risk on 9/24/2010 10:58:00 AM
Note: I apologize for the technical difficulties this AM.
The Census Bureau reports New Home Sales in August were at a seasonally adjusted annual rate (SAAR) of 288 thousand. This is unchanged from July.
 Click on graph for larger image in new window.
The first graph shows monthly new home sales (NSA - Not Seasonally Adjusted or annualized).
Note the Red columns for 2010. In August 2010, 25 thousand new homes were sold (NSA). This is a new record low for August.
The previous record low for the month of August was 34 thousand in 1981; the record high was 110 thousand in August 2005.
 The second graph shows New Home Sales vs. recessions for the last 47 years. The dashed line is the current sales rate.
Sales of new single-family houses in August 2010 were at a seasonally adjusted annual rate of 288,000, according to estimates released jointly today by the U.S. Census Bureau and the Department of Housing and Urban Development. This is unchanged (±16.7%)* from the revised July rate of 288,000 and is 28.9 percent (±11.0%) below the August 2009 estimate of 405,000.And another long term graph - this one for New Home Months of Supply.
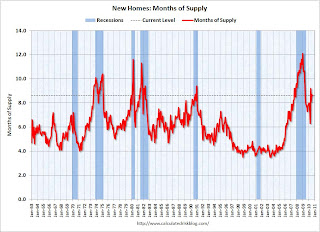 Months of supply decreased to 8.6 in August from 8.7 in July. The all time record was 12.4 months of supply in January 2009. This is still very high (less than 6 months supply is normal).
The seasonally adjusted estimate of new houses for sale at the end of August was 206,000. This represents a supply of 8.6 months at the current sales rate.
 The final graph shows new home inventory.
 The 288 thousand annual sales rate for August is just above the all time record low in May (282 thousand). This was another very weak report. New home sales are important for the economy and jobs - and this indicates that residential investment will be a sharp drag on GDP in Q3.
New Home Sales: Unchanged from July, Worst August on Record
by Calculated Risk on 9/24/2010 10:00:00 AM
NOTE: My host (Google) is not uploading images this morning - I'm working on a fix. You can follow the links to the images.
The Census Bureau reports New Home Sales in August were at a seasonally adjusted annual rate (SAAR) of 288 thousand. This is unchanged from July.
Here is the graph for New Home Sales NSA.
The first graph shows monthly new home sales (NSA - Not Seasonally Adjusted or annualized).
Note the Red columns for 2010. In August 2010, 25 thousand new homes were sold (NSA). This is a new record low for August.
The previous record low for the month of August was 34 thousand in 1981; the record high was 110 thousand in August 2005.
The second graph shows New Home Sales vs. recessions for the last 47 years.
Sales of new single-family houses in August 2010 were at a seasonally adjusted annual rate of 288,000, according to estimates released jointly today by the U.S. Census Bureau and the Department of Housing and Urban Development. This is unchanged (±16.7%)* from the revised July rate of 288,000 and is 28.9 percent (±11.0%) below the August 2009 estimate of 405,000.And another long term graph - this one for New Home Months of Supply.
The third graph is for Months of Supply
Months of supply decreased to 8.6 in August from 8.7 in July. The all time record was 12.4 months of supply in January 2009. This is still very high (less than 6 months supply is normal).
The seasonally adjusted estimate of new houses for sale at the end of August was 206,000. This represents a supply of 8.6 months at the current sales rate.The final graph shows new home inventory.
The 288 thousand annual sales rate for August is just above the all time record low in May (282 thousand). This was another very weak report. New home sales are important for the economy and jobs - and this indicates that residential investment will be a sharp drag on GDP in Q3.
Note: Sorry for the technical problems.
Durable Goods Orders decreased 1.3% in August
by Calculated Risk on 9/24/2010 08:30:00 AM
From the Census Bureau:
New orders for manufactured durable goods in August decreased $2.5 billion or 1.3 percent to $191.2 billion, the U.S. Census Bureau announced today. Down three of the last four months, this decrease followed a 0.7 percent July increase. Excluding transportation, new orders increased 2.0 percent. Excluding defense, new orders decreased 1.2 percent.This was below the consensus for a decline of 1.0%.
...
Shipments of manufactured durable goods in August, down following two consecutive monthly increases, decreased $3.1 billion or 1.5 percent to $197.9 billion.
Next up: New home sales at 10 AM ET.
Thursday, September 23, 2010
Obama pushes China on exchange rate
by Calculated Risk on 9/23/2010 10:09:00 PM
From David Sanger at the NY Times: With Warning, Obama Presses Chinese Leader on Currency
President Obama increased pressure on China to immediately revalue its currency on Thursday, devoting most of a two-hour meeting with China’s prime minister to the issue and sending the message, according to one of his top aides, that if “the Chinese don’t take actions, we have other means of protecting U.S. interests.”The old imbalances have returned - as the trade data and west coast port traffic data show - but I don't have much confidence that the Chinese will take action.
But Prime Minister Wen Jiabao barely budged ...


