by Calculated Risk on 12/04/2013 07:03:00 AM
Wednesday, December 04, 2013
MBA: Mortgage Applications Decrease in Latest Survey
First, an interesting article from Shayndi Raice at the WSJ: Smaller Mortgage Lenders Lead Field
As of the third quarter, smaller mortgage players held a 60% market share of the U.S. origination market, up from 39% in 2009, according to industry publication Inside Mortgage Finance.This shift in market share has possible implications for the MBA purchase index. Back in 2007, the MBA index started to increase - and some observers like Alan Greenspan thought this meant the housing bust was over. I pointed out back then that the index was being distorted by a shift from smaller lenders to larger lenders (the smaller lenders were going out of business). The MBA index includes many lenders, but is skewed towards the larger lenders.
...
The midsize and smaller players have grown despite tightening their underwriting standards, much like larger banks have since the financial crisis. But the smaller banks' capital rules aren't as stringent as those that make mortgages a costly enterprise for the biggest firms.
Now the index is probably understating the activity in the market - because there is a market shift from large lenders to smaller lenders.
From the MBA: Mortgage Applications Fall During Holiday-Shortened Week
Mortgage applications decreased 12.8 percent from one week earlier, according to data from the Mortgage Bankers Association’s (MBA) Weekly Mortgage Applications Survey for the week ending November 29, 2013. This week’s results include an adjustment for the Thanksgiving holiday. ...
The Refinance Index decreased 18 percent from the previous week and is at its lowest level since the week ending September 6, 2013. The seasonally adjusted Purchase Index decreased 4 percent from one week earlier. ...
...
The average contract interest rate for 30-year fixed-rate mortgages with conforming loan balances ($417,000 or less) increased to 4.51 percent from 4.48 percent, with points increasing to 0.38 from 0.31 (including the origination fee) for 80 percent loan-to-value ratio (LTV) loans.
emphasis added
 Click on graph for larger image.
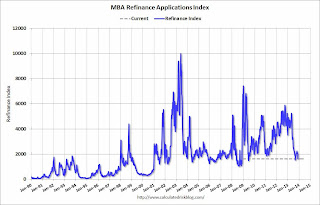
The first graph shows the refinance index.
The refinance index is down sharply - and down 69% from the levels in early May.
 The second graph shows the MBA mortgage purchase index.
 The 4-week average of the purchase index is now down about 8% from a year ago.
Tuesday, December 03, 2013
Wednesday: New Home Sales, Trade Deficit, ADP Employment, ISM Service, Beige Book and More
by Calculated Risk on 12/03/2013 07:50:00 PM
From Cardiff Garcia at FT Alphaville: ISM vs the hard data
Two recent notes emphasise that the impressive recent ISM manufacturing readings in the US are probably as much about expectations of future performance as about what has already happened.Another hint that economic growth will increase in 2014.
...
Tom Porcelli of RBC Capital Markets highlights the point that ISM is normally a leading indicator for the hard data:
ISM new orders has historically led the 3-month run rate of capex shipments by about one full quarter. Bottom line: the ISM data continue to flag an acceleration in capex growth near term.
Wednesday:
• At 7:00 AM ET, the Mortgage Bankers Association (MBA) will release the results for the mortgage purchase applications index.
• At 8:15 AM, the ADP Employment Report for November. This report is for private payrolls only (no government). The consensus is for 185,000 payroll jobs added in November, up from 130,000 in October.
• At 8:30 AM, the Trade Balance report for October from the Census Bureau. The consensus is for the U.S. trade deficit to decrease to $40.2 billion in October from $41.8 billion in September.
• At 10:00 AM, the New Home Sales for September and October from the Census Bureau. The consensus is for an increase in sales to 425 thousand Seasonally Adjusted Annual Rate (SAAR) in October from 421 thousand in August.
• Also at 10:00 AM, the ISM non-Manufacturing Index for November. The consensus is for a reading of 55.5, up from 55.4 in October. Note: Above 50 indicates expansion, below 50 contraction.
• Also at 10:00 AM, the Trulia Price Rent Monitors for November. This is the index from Trulia that uses asking house prices adjusted both for the mix of homes listed for sale and for seasonal factors.
• At 2:00 PM. the Federal Reserve Beige Book, an informal review by the Federal Reserve Banks of current economic conditions in their Districts.
Lawler: Single Family Inventory Down Again, But Pace of Decline Slowed in Q3
by Calculated Risk on 12/03/2013 04:17:00 PM
From housing economist Tom Lawler:
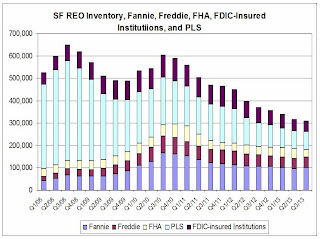
The overall SF REO inventory appears to have declined again last quarter, though the pace of decline slowed. Both Fannie and Freddie reported slight increases last quarter, reflecting modest increases in acquisitions (mainly in judicial foreclosure states) and declines in dispositions in part reflecting “market conditions. FHA’s SF REO inventory, in contrast, declined last quarter following increases in the previous two quarters.
REO inventory both held by private-label securities and at FDIC-insured institutions also fell last quarter, though at a slower pace than the previous few quarters. (Note: I get my PLS inventory estimates from Barclays Capital, but only have data through August. For FDIC-insured institutions, I assume that the average carrying value is 50% higher than that at Fannie and Freddie).
 Click on graph for larger image.
CR Note: This is most, but not all, of the lender owner foreclosure inventory, aka "Real Estate Owned" (REO). There is also REO for the VA, and some other non-FDIC insured institutions - but this is probably close to 90% of all REOs.
U.S. Light Vehicle Sales increase to 16.4 million annual rate in November, Highest since Feb 2007
by Calculated Risk on 12/03/2013 02:03:00 PM
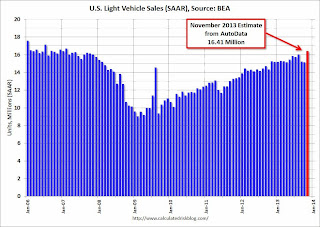
Based on an estimate from AutoData, light vehicle sales were at a 16.41 million SAAR in November. That is up 7.6% from November 2012, and up 8.3% from the sales rate last month. Some of the sales in November might be a bounce back from the weakness in October related to the government shutdown.
This was above the consensus forecast of 15.7 million SAAR (seasonally adjusted annual rate).
This graph shows the historical light vehicle sales from the BEA (blue) and an estimate for November (red, light vehicle sales of 16.41 million SAAR from AutoData).
 Click on graph for larger image.
This was the highest sales rate since February 2007, and was probably due to some bounce back buying following the government shutdown.
The growth rate will probably slow in 2013 - compared to the previous three years - but this will still be another solid year for the auto industry.
The second graph shows light vehicle sales since the BEA started keeping data in 1967.
 Note: dashed line is current estimated sales rate.
Unlike residential investment, auto sales bounced back fairly quickly following the recession and are still a key driver of the recovery. Looking forward, growth will slow for auto sales. If sales average the recent pace for the entire year, total sales will be up almost 9% from 2012, not quite double digit but still strong.
Fannie, Freddie, FHA REO inventory declined slightly in Q3
by Calculated Risk on 12/03/2013 11:06:00 AM
The FHA has stopped releasing REO inventory as part of their monthly report, however they provided me the most recent data today (for October).
In their Q3 SEC filing, Fannie reported their Real Estate Owned (REO) increased to 100,941 single family properties, up from 96,920 at the end of Q2. Freddie reported their REO increased to 47,119 in Q3, up from 44,623 at the end of Q2.
The FHA reported their REO decreased to 32,226 (as of October), down from 41,838 in Q2. This reverses a recent trend of increasing REO inventory at the FHA.
The combined Real Estate Owned (REO) for Fannie, Freddie and the FHA declined to 180,286, down from 183,381 at the end of Q2 2013. The peak for the combined REO of the F's was 295,307 in Q4 2010.
This following graph shows the REO inventory for Fannie, Freddie and the FHA.
 Click on graph for larger image.
This is only a portion of the total REO. There is also REO for private-label MBS, FDIC-insured institutions, VA and more. REO has been declining for those categories too.
Although REO was up for Fannie and Freddie in Q3 from Q2, REO decreased for the FHA - and overall REO was down for the twelfth consecutive quarter.


