by Calculated Risk on 11/15/2009 07:31:00 PM
Sunday, November 15, 2009
Housing Starts and Vacant Units: No "V" Shaped Recovery
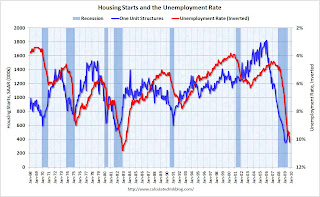
On Friday I posted a graph showing the historical relationship between housing starts and the unemployment rate (repeated as the 2nd graph below). The graph shows that housing leads the economy both into and out of recessions, and the unemployment rate lags housing by about 12 to 18 months.
It appears that housing starts bottomed earlier this year, however I don't think we will see a sharp recovery in housing this time - and I also think unemployment will remain high throughout 2010. As I noted in the earlier post, there is still a large overhang of vacant housing in the United States, and a sharp bounce back in housing starts is unlikely.
The following graph shows total housing starts and the percent vacant housing units (owner and rental) in the U.S. Note: this is a combined vacancy rate based on the Census Bureau vacancy rates for owner occupied and rental housing. Click on graph for larger image in new window.
It is very unlikely that there will be a strong rebound in housing starts with a record number of vacant housing units.
The vacancy rate has continued to climb even after housing starts fell off a cliff. Initially this was because of a significant number of completions. Also some hidden inventory (like some 2nd homes) have become available for sale or for rent, and lately some households have probably doubled up because of tough economic times.
Note: the increase in the vacancy rate in the '80s was due to several factors including demographics (baby boomers moving from renting to owning), and overbuilding of apartment units (part of S&L crisis).
Here is a repeat of the earlier graph: This graph shows single family housing starts and unemployment (inverted). (The first graph shows total housing starts)
You can see both the correlation and the lag. The lag is usually about 12 to 18 months, with peak correlation at a lag of 16 months for single unit starts. The 2001 recession was a business investment led recession, and the pattern didn't hold.
This suggests unemployment might peak in Spring or Summer 2010. However, since I expect the housing recovery to be sluggish, I also expect unemployment to remain high throughout 2010.
Friday, September 18, 2009
Unemployment Rates: California, Nevada, and Rhode Island set new series highs
by Calculated Risk on 9/18/2009 11:26:00 AM
From the BLS: Regional and State Employment and Unemployment Summary
Twenty-seven states and the District of Columbia reported over-the-month unemployment rate increases, 16 states registered rate decreases, and 7 states had no rate change, the U.S. Bureau of Labor Statistics reported today. Over the year, jobless rates increased in all 50 states and the District of Columbia.
...
Fourteen states and the District of Columbia reported jobless rates of at least 10.0 percent in August. Michigan continued to have the highest unemployment rate among the states, 15.2 percent. Nevada recorded the next highest rate, 13.2 percent, followed by Rhode Island, 12.8 percent, and California and Oregon, 12.2 percent each. The rates in California, Nevada, and Rhode Island set new series highs.
emphasis added
 Click on graph for larger image in new window.
This graph shows the high and low unemployment rates for each state (and D.C.) since 1976. The red bar is the current unemployment rate (sorted by the current unemployment rate).
Fourteen states and D.C. now have double digit unemployment rates.
Illinois, Indiana, and Georgia are all close.
Four states are at record unemployment rates: Rhode Island, Oregon, Nevada, and California. Several others - like Florida and Georgia - are close.
Saturday, August 08, 2009
Housing Starts and the Unemployment Rate
by Calculated Risk on 8/08/2009 11:22:00 PM
Reader Mark sent me a link to a talk by Jon Fisher, a professor at the University of San Francisco School of Business. Jon made the point that housing starts and unemployment are inversely correlated.
Of course readers here know that housing lead the economy, and employment lags. So naturally housing and unemployment are inversely correlated with a lag.
Note: Dr. Leamer's Sept 2007 paper: Housing is the Business Cycle is an excellent overview of how housing leads the economy. (Something I covered extensively in 2005) Click on graph for larger image in new window.
This graph shows housing starts (both total and single unit) and unemployment (inverted).
You can see both the correlaton and the lag. The lag is usually about 12 to 18 months, with peak correlation at a lag of 16 months for single unit starts. The 2001 recession was a business investment led recession, and the pattern didn't hold.
This suggests unemployment might peak in Spring 2010.
Professor Fisher argued that unemployment will rise to about 10.4% and then fall rapidly. He is basing the rapid decline on a "V shaped" housing recovery similar to previous recessions. I disagree with that point.
In most earlier recessions, the slumps were caused by the Fed raising interest rates to fight inflation. When the Fed cut rates, housing bounced back sharply (V shaped).
Although this recession was led by a housing bust - and that makes it look similar to some previous periods - this recession was not engineered by the Fed raising rates, rather it was the busting of the credit and housing bubbles, and all the related problems that led the economy into recession. Since there is still far too much existing home inventory, a sharp bounce back in housing starts is unlikely, so I think Fisher's forecast for a rapid decline in unemployment is also unlikely.
Sunday, June 21, 2009
Miami, Chicago, Dallas: Real House Prices and Unemployment Rate
by Calculated Risk on 6/21/2009 03:42:00 PM
Yesterday I posted a comparison of national real house prices and the unemployment rate. Today I'm posting the comparison for various cities.
Previous posts:
National Real House prices and the unemployment rate.
Washington, D.C. real prices and unemployment.
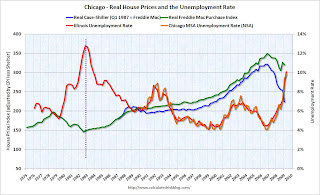
Notes: House prices are from Case-Shiller (back to 1987 for Miami and Chicago, and 2000 for Dallas) and Freddie Mac's Purchase index (back to 1975). The Case-Shiller index was set equal to the Freddie Mac index in Q1 1987 (Q 2000 for Dallas), and then both indexes adjusted by CPI less shelter for South Urban cities (Chicago used Midwest urban cities).
The red unemployment rate is for the states and only goes back to 1976. The orange unemployment line is for the metropolitan statistical areas (MSA)
Note the scale of unemployment rate doesn't start at zero (to better compare to house prices). Click on image for larger graph in new window.
In Miami, real house prices increased in the last '70s, but those increases were dwarfed by the current bubble.
Miami doesn't have a good example of a previous bubble to compare falling house prices and the unemployment rate.
Maybe if we had data back to the great Florida housing bubble of the 1920s! The second graph is for Chicago.
Chicago has an example of a previous housing bubble in the late '70s. And house prices fell basically until the unemployment rate peaked (see dashed purple line).
And the third graph is for Dallas.
Dallas had a housing price bubble in the early '80s because of high oil prices during that period. House prices and the unemployment rate appear unrelated, and we would probably have to look at net migration to understand why prices fell.
The pattern I expect is for house prices to fall (after a bubble) until the unemployment rate peaks - and possibly for some time after the unemployment rate peaks.
Some serious bubble cities to come ...


