 RSS Feed
 by Calculated Risk on 3/16/2011 08:30:00 AM
Showing posts with label Housing Starts. Show all posts
Showing posts with label Housing Starts. Show all posts
Wednesday, March 16, 2011
Housing Starts decrease sharply in February
 Click on graph for larger image in graph gallery.
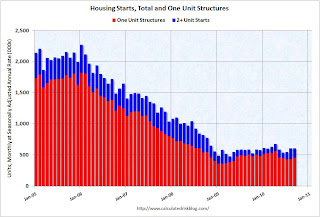
Total housing starts were at 479 thousand (SAAR) in February, down 22.5% from the revised January rate of 618 thousand, and barely up from the all time record low in April 2009 of 477 thousand (the lowest level since the Census Bureau began tracking housing starts in 1959).
Single-family starts decreased 11.8% to 375 thousand in February - the lowest level since early 2009.
 The second graph shows total and single unit starts since 1968. This shows the huge collapse following the housing bubble, and that housing starts have mostly been moving sideways for over two years - with slight ups and downs due to the home buyer tax credit.
Here is the Census Bureau report on housing Permits, Starts and Completions.
Housing Starts:This was well below expectations of 560 thousand starts, and near the record low.
Privately-owned housing starts in February were at a seasonally adjusted annual rate of 479,000. This is 22.5 percent (±9.8%) below the revised January estimate of 618,000 and is 20.8 percent (±9.0%) below the February 2010 rate of 605,000.
Single-family housing starts in February were at a rate of 375,000; this is 11.8 percent (±10.0%) below the revised January figure of 425,000. The February rate for units in buildings with five units or more was 96,000.
Building Permits:
Privately-owned housing units authorized by building permits in February were at a seasonally adjusted annual rate of 517,000. This is 8.2 percent (±3.3%) below the revised January rate of 563,000 and is 20.5 percent (±3.5%) below the February 2010 estimate of 650,000.
Single-family authorizations in February were at a rate of 382,000; this is 9.3 percent (±1.2%) below the revised January figure of 421,000. Authorizations of units in buildings with five units or more were at a rate of 121,000 in February.
This low level of starts is good news for housing, and I expect starts to stay low until more of the excess inventory of existing homes is absorbed. Note: This is the lowest level for Building permits since the Census Bureau started tracking permits.
Wednesday, January 19, 2011
Housing Starts Decline in December
by Calculated Risk on 1/19/2011 08:30:00 AM
 Click on graph for larger image in graph gallery.
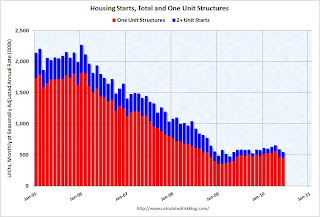
Total housing starts were at 529 thousand (SAAR) in December, down 4.3% from the revised November rate of 553 thousand, and up 11% from the all time record low in April 2009 of 477 thousand (the lowest level since the Census Bureau began tracking housing starts in 1959).
Single-family starts decreased 9.0% to 417 thousand in December - the lowest level since early 2009.
 The second graph shows total and single unit starts since 1968. This shows the huge collapse following the housing bubble, and that housing starts have mostly been moving sideways for two years - with a slight ups and downs due to the home buyer tax credit.
There was an increase in permits, especially for multi-family units.
Here is the Census Bureau report on housing Permits, Starts and Completions.
Housing Starts:This was below expectations of 550 thousand starts. The low level of starts is good news for housing, and I expect Starts to stay low until more of the excess inventory of existing homes is absorbed. But I do expect starts to increase in 2011 from this low level.
Privately-owned housing starts in December were at a seasonally adjusted annual rate of 529,000. This is 4.3 percent (±14.1%)* below the revised November estimate of 553,000 and is 8.2 percent (±14.4%)* below the December 2009 rate of 576,000.
Single-family housing starts in December were at a rate of 417,000; this is 9.0 percent (±11.7%)* below the revised November figure of 458,000.
Building Permits:
Privately-owned housing units authorized by building permits in December were at a seasonally adjusted annual rate of 635,000. This is 16.7 percent (±2.1%) above the revised November rate of 544,000, but is 6.8 percent(±2.8%) below the December 2009 estimate of 681,000.
Single-family authorizations in December were at a rate of 440,000; this is 5.5 percent (±2.3%) above the revised November figure of 417,000.
Wednesday, November 17, 2010
Housing Starts decline in October
by Calculated Risk on 11/17/2010 08:30:00 AM
 Click on graph for larger image in new window.
Total housing starts were at 519 thousand (SAAR) in October, down 11.7% from the revised September rate of 588 thousand, and just up 9% from the all time record low in April 2009 of 477 thousand (the lowest level since the Census Bureau began tracking housing starts in 1959).
Most of the decline this month was due to multi-family starts (after two strong months).
Single-family starts decreased 1.1% to 436 thousand in October. This is 21% above the record low in January 2009 (360 thousand).
 The second graph shows total and single unit starts since 1968. This shows the huge collapse following the housing bubble, and that housing starts have mostly been moving sideways for almost two years - with a slight up and down over the last six months due to the home buyer tax credit.
Here is the Census Bureau report on housing Permits, Starts and Completions.
Housing Starts:This was below expectations of 590 thousand starts, mostly because of the volatile multi-family starts. Starts will stay low until the excess inventory of existing homes is absorbed.
Privately-owned housing starts in October were at a seasonally adjusted annual rate of 519,000. This is 11.7 percent (±8.6%) below the revised September estimate of 588,000 and is 1.9 percent (±9.6%)* below the October 2009 rate of 529,000.
Single-family housing starts in October were at a rate of 436,000; this is 1.1 percent (±8.6%)* below the revised September figure of 441,000.
Building Permits:
Privately-owned housing units authorized by building permits in October were at a seasonally adjusted annual rate of 550,000. This is 0.5 percent (±3.0%)* above the revised September rate of 547,000, but is 4.5 percent (±3.1%) below the October 2009 estimate of 576,000.
Single-family authorizations in October were at a rate of 406,000; this is 1.0 percent (±1.3%)* above the revised September figure of 402,000.
Tuesday, October 19, 2010
Housing Starts increase in September
by Calculated Risk on 10/19/2010 08:30:00 AM
 Click on graph for larger image in new window.
Total housing starts were at 610 thousand (SAAR) in September, up 0.3% from the revised August rate of 608 thousand (revised up from 598 thousand), and up 28% from the all time record low in April 2009 of 477 thousand (the lowest level since the Census Bureau began tracking housing starts in 1959).
There has been an increase in multi-family starts over the last two months, although single family starts are significantly below the levels of earlier this year.
Single-family starts increased 4.4% to 452 thousand in August. This is 25% above the record low in January 2009 (360 thousand).
 The second graph shows total and single unit starts since 1968. This shows the huge collapse following the housing bubble, and that housing starts have mostly been moving sideways for almost two years - with a slight up and down over the last six months due to the home buyer tax credit.
Here is the Census Bureau report on housing Permits, Starts and Completions.
Housing Starts:This was above expectations of 580 thousand starts, mostly because of the volatile multi-family starts. As I've mentioned many times - this low level of starts is good news for the housing market longer term (there are too many housing units already), but bad news for the economy and employment short term.
Privately-owned housing starts in September were at a seasonally adjusted annual rate of 610,000. This is 0.3 percent (±10.3%)* above the revised August estimate of 608,000 and is 4.1 percent (±12.0%)* above theSeptember 2009 rate of 586,000.
Single-family housing starts in September were at a rate of 452,000; this is 4.4 percent (±13.9%)* above the revised August figure of 433,000.
Building Permits:
Privately-owned housing units authorized by building permits in September were at a seasonally adjusted annual rate of 539,000. This is 5.6 percent (±1.4%) below the revised August rate of 571,000 and is 10.9 percent (±2.3%) below the September 2009 estimate of 605,000.
Single-family authorizations in September were at a rate of 405,000; this is 0.5 percent (±1.3%)* above the revised August figure of 403,000.
Tuesday, September 21, 2010
Single Family Housing Starts increase slightly in August
by Calculated Risk on 9/21/2010 08:30:00 AM
 Click on graph for larger image in new window.
Total housing starts were at 598 thousand (SAAR) in August, up 10.5% from the revised July rate of 541 thousand (revised down from 546 thousand), and up 25% from the all time record low in April 2009 of 477 thousand (the lowest level since the Census Bureau began tracking housing starts in 1959).
Single-family starts increased 4.3% to 438 thousand in August. This is 22% above the record low in January 2009 (360 thousand). 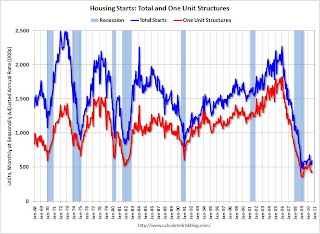 The second graph shows total and single unit starts since 1968. This shows the huge collapse following the housing bubble, and that housing starts have mostly been moving sideways for over a year - with a slight up and down over the last several months due to the home buyer tax credit.
Here is the Census Bureau report on housing Permits, Starts and Completions.
Housing Starts:This was above expectations of 550 thousand, mostly because of the volatile multi-family starts. As I've mentioned many times - this low level of starts is good news for the housing market longer term (there are too many housing units already), but bad news for the economy and employment short term.
Privately-owned housing starts in August were at a seasonally adjusted annual rate of 598,000. This is 10.5 percent (±11.9%)* above the revised July estimate of 541,000 and is 2.2 percent (±9.7%)* above the August 2009 rate of 585,000.
Single-family housing starts in August were at a rate of 438,000; this is 4.3 percent (±12.4%)* above the revised July figure of 420,000.
Building Permits:
Privately-owned housing units authorized by building permits in August were at a seasonally adjusted annual rate of 569,000. This is 1.8 percent (±2.0%)* above the revised July rate of 559,000, but is 6.7 percent (±1.4%) below the August 2009 estimate of 610,000.
Single-family authorizations in August were at a rate of 401,000; this is 1.2 percent (±1.0%) below the revised July figure of 406,000.
Tuesday, August 17, 2010
Single Family Housing Starts decline in July
by Calculated Risk on 8/17/2010 08:30:00 AM
 Click on graph for larger image in new window.
Total housing starts were at 546 thousand (SAAR) in July, up 1.7% from the revised June rate of 537 thousand (revised down from 549 thousand), and up 14% from the all time record low in April 2009 of 477 thousand (the lowest level since the Census Bureau began tracking housing starts in 1959).
Single-family starts declined 4.2% to 432 thousand in July. This is 20% above the record low in January 2009 (360 thousand).  The second graph shows total and single unit starts since 1968. This shows the huge collapse following the housing bubble, and that housing starts have mostly been moving sideways for over a year - with a slight up and down over the last several months due to the home buyer tax credit.
Here is the Census Bureau report on housing Permits, Starts and Completions.
Housing Starts:This was below expectations of 565 thousand, and is good news for the housing market longer term (there are too many housing units already), but bad news for the economy and employment short term.
Privately-owned housing starts in July were at a seasonally adjusted annual rate of 546,000. This is 1.7 percent (±9.7%)* above the 9.7%) revised June estimate of 537,000, but is 7.0 percent (±7.5%)* below the July 2009 rate of 587,000.
Single-family housing starts in July were at a rate of 432,000; this is 4.2 percent (±8.7%)* below the revised June figure of 451,000.
Building Permits:
Privately-owned housing units authorized by building permits in July were at a seasonally adjusted annual rate of 565,000. This is 3.1 percent (±2.0%) below the revised June rate of 583,000 and is 3.7 percent (±2.2%) below the July 2009 estimate of 587,000.
Single-family authorizations in July were at a rate of 416,000; this is 1.2 percent (±1.2%)* below the revised June figure of 421,000.
Tuesday, July 20, 2010
Housing Starts decline in June
by Calculated Risk on 7/20/2010 08:30:00 AM
 Click on graph for larger image in new window.
Total housing starts were at 549 thousand (SAAR) in June, down 5% from the revised May rate of 578,000 (revised down from 593 thousand), and up 15% from the all time record low in April 2009 of 477 thousand (the lowest level since the Census Bureau began tracking housing starts in 1959).
Single-family starts declined 0.7% to 454,000 in June. This is 26% above the record low in January 2009 (360 thousand). 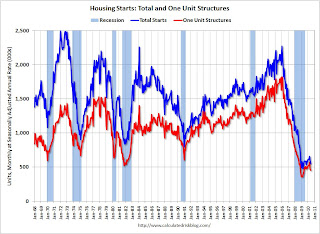 The second graph shows total and single unit starts since 1968. This shows the huge collapse following the housing bubble, and that housing starts have mostly been moving sideways for over a year.
Here is the Census Bureau report on housing Permits, Starts and Completions.
Housing Starts:This is way below expectations of 580 thousand (I took the under!), and is good news for the housing market longer term (there are too many housing units already), but bad news for the economy and employment short term.
Privately-owned housing starts in June were at a seasonally adjusted annual rate of 549,000. This is 5.0 percent (±13.2%)* below the 13.2%) revised May estimate of 578,000 and is 5.8 percent (±10.5%)* below the June 2009 rate of 583,000.
Single-family housing starts in June were at a rate of 454,000; this is 0.7 percent (±10.7%)* below the revised May figure of 457,000.
Building Permits:
Privately-owned housing units authorized by building permits in June were at a seasonally adjusted annual rate of 586,000. This is 2.1 percent (±2.1%)* above the revised May rate of 574,000, but is 2.3 percent (±2.0%) below the June 2009 estimate of 600,000.
Single-family authorizations in June were at a rate of 421,000; this is 3.4 percent (±1.8%) below the revised May figure of 436,000.
Saturday, June 19, 2010
Housing Starts and the Unemployment Rate
by Calculated Risk on 6/19/2010 09:02:00 PM
An update on a theme ...  Click on graph for larger image in new window.
This graph shows single family housing starts and the unemployment rate through May (inverted).
You can see both the correlation and the lag. The lag is usually about 12 to 18 months, with peak correlation at a lag of 16 months for single unit starts. The 2001 recession was a business investment led recession, and the pattern didn't hold.
Usually housing starts and residential construction employment lead the economy out of a recession, but not this time because of the huge overhang of existing housing units. After rebounding a little in early '09, housing starts (blue) have mostly moved sideways.
This is what I expected when I first posted the above graph last summer. I wrote:
[T]here is still far too much existing home inventory, a sharp bounce back in housing starts is unlikely, so I think ... a rapid decline in unemployment is also unlikely.Usually near the end of a recession, residential investment (RI) picks up as the Fed lowers interest rates. This lead to job creation and also household formation - and that leads to even more demand for housing units - and more jobs, and more households - a virtuous cycle that usually helps the economy recovery.
Note: RI is mostly new home sales and home improvement.
However this time, with the huge overhang of existing housing units, this key sector isn't participating. So in this recovery there is less job creation, less household formation, and less demand for housing units than a normal recovery. This is sort of a circular trap for both GDP growth and employment.
Eventually the excess housing units will be absorbed - (progress is slowly being made, see Housing Stock and Flow) - but until then, this key sector will remain under pressure and I expect the recovery will be sluggish and the unemployment rate will stay elevated.
Friday, June 18, 2010
Lumber Prices off 30% since April
by Calculated Risk on 6/18/2010 03:39:00 PM
By request, a graph of lumber prices ... Click on graph for larger image in new window.
From the NAHB, framing lumber prices have collapsed since the end of April.
This graph shows two measures of lumber prices: 1) from Random Lengths (via NAHB), and 2) CME futures.
With so many mills shut down during the bust, the supply of lumber was way down - and prices surged early this year. Now that construction has slowed, prices have collapsed.
Wednesday, June 16, 2010
Housing Starts plummet in May
by Calculated Risk on 6/16/2010 08:30:00 AM
 Click on graph for larger image in new window.
Total housing starts were at 593 thousand (SAAR) in May, down 10% from the revised April rate of 659,000 (revised down from 672 thousand), and up 24% from the all time record low in April 2009 of 477 thousand (the lowest level since the Census Bureau began tracking housing starts in 1959).
Single-family starts collapsed 17.2% to 468,000 in May. This is 30% above the record low in January 2009 (360 thousand).  The second graph shows total and single unit starts since 1968. This shows the huge collapse following the housing bubble, and that housing starts have mostly been moving sideways for over a year.
Here is the Census Bureau report on housing Permits, Starts and Completions.
Housing Starts:Note that permits fell sharply, suggesting another significant decline in housing starts next month. This is way below expectations (I took the under!), and is good news for the housing market longer term (there are too many housing units already), but bad news for the economy and employment short term.
Privately-owned housing starts in May were at a seasonally adjusted annual rate of 593,000. This is 10.0 percent (±10.3%)* below the revised April estimate of 659,000, but is 7.8 percent (±9.7%)* above the May 2009 rate of 550,000.
Single-family housing starts in May were at a rate of 468,000; this is 17.2 percent (±7.9%) below the revised April figure of 565,000.
Building Permits:
Privately-owned housing units authorized by building permits in May were at a seasonally adjusted annual rate of 574,000. This is 5.9 percent (±2.2%) below the revised April rate of 610,000, but is 4.4 percent (±2.6%) above the May 2009 estimate of 550,000.
Single-family authorizations in May were at a rate of 438,000; this is 9.9 percent (±2.1%) below the revised April figure of 486,000. Authorizations of units in buildings with five units or more were at a rate of 117,000 in May.
Tuesday, May 18, 2010
Q1: Quarterly Housing Starts and New Home Sales
by Calculated Risk on 5/18/2010 11:27:00 AM
This morning the Census Bureau released the "Quarterly Starts and Completions by Purpose and Design" report for Q1 2010.  Click on graph for larger image in new window.
The first graph shows the NSA quarterly starts intent for four categories since 1975: single family built for sale, owner built (includes contractor built for owner), starts built for rent, and condos built for sale.
Condo starts in Q1 were just above the all time record low last quarter (4,000 vs 3,000 in Q4 2009).
Units built for rent set an all time record low in Q1 (19,000 units in Q1 2010 compared to the previous record low of 20,000 units in Q4 2009). This year a record low number of rental units will be built, and that is one reason the rental vacancy rate should continue to decline (household formation should be significantly higher than the increase in housing units in 2010).
Owner built units are just above the record low set in Q1 2009 (25,000 units in Q1 2010 compared to 24,000 units in Q1 2009).
And the largest category - starts of single family units, built for sale - increased to 86,000 in Q1.
With starts so low in every category, the number of units added to the housing stock in 2010 will be at a record low - and that will help reduce the significant excess inventory of housing units.
Comparing Housing Starts and New Home Sales
Monthly housing starts (even single family starts) cannot be compared directly to new home sales, because the monthly housing starts report from the Census Bureau includes apartments, owner built units and condos that are not included in the new home sales report.
However it is possible to compare "Single Family Starts, Built for Sale" to New Home sales on a quarterly basis. This is not perfect because of reporting differences and changes in cancellation rate - but it is close. The quarterly report shows that there were 86,000 single family starts, built for sale, in Q1 2010, and that is the same as the 86,000 new homes sold for the same period. This data is Not Seasonally Adjusted (NSA).
This breaks a streak of 9 consecutive quarter with homebuilders selling more homes than they started.
Note: new home sales are reported when contracts are signed, so it is appropriate to compare sales to starts (as opposed to completions).  This graph provides a quarterly comparison of housing starts and new home sales. In 2005, and most of 2006, starts (blue) were higher than sales (red), and inventories of new homes increased. For the previous 9 quarters, starts were below sales – and new home inventories declined. In Q1 starts and sales were about the same. Historically builders sell more home in Q1 than they start, but they probably started more homes this year anticipating some extra sales in April related to the expiring tax credit.
Housing Starts increase in April
by Calculated Risk on 5/18/2010 08:30:00 AM
 Click on graph for larger image in new window.
Total housing starts were at 672 thousand (SAAR) in April, up 5.8% from the revised March rate, and up 41% from the all time record low in April 2009 of 477 thousand (the lowest level since the Census Bureau began tracking housing starts in 1959).
Single-family starts were at 593 thousand (SAAR) in April, up 10.2% from the revised February rate, and 65% above the record low in January 2009 (360 thousand).  The second graph shows total and single unit starts since 1968. This shows the huge collapse following the housing bubble, and that housing starts are still very low.
Here is the Census Bureau report on housing Permits, Starts and Completions.
Housing Starts:Note that permits fell sharply, suggesting a significant decline in housing starts next month.
Privately-owned housing starts in April were at a seasonally adjusted annual rate of 672,000. This is 5.8 percent (±13.0%)* above the revised March estimate of 635,000 and is 40.9 percent (±19 8%) above the revised April 2009 rate of 477,000.
Single-family housing starts in April were at a rate of 593,000; this is 10.2 percent (±10.7%)* above the revised March figure of 538,000.
Housing Completions:
Privately-owned housing completions in April were at a seasonally adjusted annual rate of 769,000. This is 19.2 percent (±13.8%) above the revised March estimate of 645,000, but is 8.7 percent (±12.8%)* below the revised April 2009 rate of 842,000.
Single-family housing completions in April were at a rate of 564,000; this is 14.6 percent (±13.1%) above the revised March figure of 492,000.
Building Permits:
Privately-owned housing units authorized by building permits in April were at a seasonally adjusted annual rate of 606,000. This is 11.5 percent (±1.1%) below the revised March rate of 685,000, but is 15.9 percent (±1.3%) above the revised April 2009 estimate of 523,000.
Single-family authorizations in April were at a rate of 484,000; this is 10.7 percent (±1.1%) below the revised March figure of 542,000.
Friday, April 16, 2010
Housing Starts mixed in March
by Calculated Risk on 4/16/2010 08:30:00 AM
 Click on graph for larger image in new window.
Total housing starts were at 626 thousand (SAAR) in March, up 1.6% from the revised February rate, and up 30% from the all time record low in April 2009 of 479 thousand (the lowest level since the Census Bureau began tracking housing starts in 1959).
Single-family starts were at 531 thousand (SAAR) in March, down 0.9% from the revised February rate, and 49% above the record low in January and February 2009 (357 thousand).  The second graph shows total and single unit starts since 1968. This shows the huge collapse following the housing bubble, and the slow and sluggish recovery in housing starts.
Here is the Census Bureau report on housing Permits, Starts and Completions.
Housing Starts:
Privately-owned housing starts in March were at a seasonally adjusted annual rate of 626,000. This is 1.6 percent (±15.2%)* above the revised February estimate of 616,000 and is 20.2 percent (±15.3%) above the March 2009 rate of 521,000.
Single-family housing starts in March were at a rate of 531,000; this is 0.9 percent (±12.1%)* below the revised February figure of 536,000. The March rate for units in buildings with five units or more was 88,000.
Housing Completions:
Privately-owned housing completions in March were at a seasonally adjusted annual rate of 656,000. This is 3.1 percent (±16.7%)* below the revised February estimate of 677,000 and is 21.2 percent (±8.9%) below the March 2009 rate of 833,000.
Single-family housing completions in March were at a rate of 486,000; this is 5.9 percent (±14.6%)* above the revised February rate of 459,000. The March rate for units in buildings with five units or more was 161,000.
Wednesday, March 17, 2010
Comparing New Home Sales and Housing Starts
by Calculated Risk on 3/17/2010 09:29:00 PM
 Click on graph for larger image in new window.
A frequently asked question is how do new home sales compare to single family housing starts (both series from the Census Bureau). This graph shows the two series - although they track each other, the two series cannot be directly compared.
For starts of single family structures, the Census Bureau includes owner built units and units built for rent that are not included in the new home sales report. From the Census Bureau: Comparing New Home Sales and New Residential Construction
We are often asked why the numbers of new single-family housing units started and completed each month are larger than the number of new homes sold. This is because all new single-family houses are measured as part of the New Residential Construction series (starts and completions), but only those that are built for sale are included in the New Residential Sales series. We categorize new residential construction into four intents, or purposes:However it is possible to compare "Single Family Starts, Built for Sale" to New Home sales on a quarterly basis. The Q4 quarterly report showed that there were 71,000 single family starts, built for sale, in Q4 2009, and that is less than the 82,000 new homes sold for the same period. This data is Not Seasonally Adjusted (NSA).
Built for sale (or speculatively built): the builder is offering the house and the developed lot for sale as one transaction this includes houses where ownership of the entire property including the land is acquired ("fee simple") as well as houses sold for cooperative or condominium ownership. These are the units measured in the New Residential Sales series.
Contractor-built (or custom-built): the house is built for the landowner by a general contractor, or the land and the house are purchased in separate transactions.
Owner-built: the house is built entirely by the landowner or by the landowner acting as his/her own general contractor.
Built for rent: the house is built with the intent that it be placed on the rental market when it is completed.
Q4 was the 9th consecutive quarter with homebuilders selling more homes than they start.
Note: new home sales are reported when contracts are signed, so it is appropriate to compare sales to starts (as opposed to completions). This is not perfect because homebuilders do build spec homes and many builders were stuck with some “unintentional spec homes” because of cancellations during the bust.
 This graph provides a quarterly comparison of housing starts and new home sales. In 2005, and most of 2006, starts (blue) were higher than sales (red), and inventories of new homes increased. For the last 9 quarters, starts have been below sales – and new home inventories have been falling.
It is possible that the streak will be broken in Q1, and that the builders started more single family homes, built for sale, than they sold. This is because a number of builders started some extra spec homes in anticipation of a "buying rush" in April before the tax credit expires. To qualify for the tax credit, the homes have to be finished before June 30th - and it takes close to 6 months to build a home - so some builders started a few extra homes in January that they hope will sold in Q2.
Tuesday, March 16, 2010
Housing Starts decline in February
by Calculated Risk on 3/16/2010 08:30:00 AM
 Click on graph for larger image in new window.
Total housing starts were at 575 thousand (SAAR) in February, down 5.9% from the revised January rate, and up 20% from the all time record low in April 2009 of 479 thousand (the lowest level since the Census Bureau began tracking housing starts in 1959). Starts had rebounded to 590 thousand in June, and have moved mostly sideways for nine months.
Single-family starts were at 499 thousand (SAAR) in February, down 0.6% from the revised January rate, and 40% above the record low in January and February 2009 (357 thousand). Just like for total starts, single-family starts have been at about this level for nine months.
Here is the Census Bureau report on housing Permits, Starts and Completions.
Housing Starts:This level of starts is both good news and bad news. The good news is the excess housing inventory is being absorbed - a necessary step for housing (and the economy) to recover.
Privately-owned housing starts in February were at a seasonally adjusted annual rate of 575,000. This is 5.9 percent (±10.0%)* below the revised January estimate of 611,000, but is 0.2 percent (±9.8%)* above the February 2009 rate of 574,000.
Single-family housing starts in February were at a rate of 499,000; this is 0.6 percent (±10.6%)* below the revised January figure of 502,000. The February rate for units in buildings with five units or more was 58,000.
Housing Completions:
Privately-owned housing completions in February were at a seasonally adjusted annual rate of 700,000. This is 5.4 percent (±20.2%)* above the revised January estimate of 664,000, but is 15.5 percent (±13.6%) below the February 2009 rate of 828,000.
Single-family housing completions in February were at a rate of 458,000; this is 4.3 percent (±13.7%)* above the revised January rate of 439,000. The February rate for units in buildings with five units or more was 236,000.
The bad news is economic growth will probably be sluggish - and unemployment elevated - until residential investment picks up.
Note: on the February snow storms, starts were up in the West and Midwest, and down in the Northeast and South (includes D.C. and Virginia), so the snow probably did impact starts. Of course some builders started spec homes to beat the tax credit expiration - and that boosted starts temporarily.
Sunday, March 14, 2010
Housing Market Index, Housing Starts, Snow and Spec Homes
by Calculated Risk on 3/14/2010 09:33:00 PM
As mentioned in the Weekly Summary and a Look Ahead post, the NAHB Housing Market Index for March, and Housing Starts for February, will both be released early this week.
Here is a graph showing the relationship between the two series: Click on graph for larger image in new window.
This graph compares the NAHB HMI (left scale) with single family housing starts (right scale). This includes the February release for the HMI and the January data for single family starts.
This shows that the HMI and single family starts mostly move in the same direction - although there is plenty of noise month-to-month. Since the NAHB index increased slightly in February (it is released a month ahead of starts), we might expect some increase in February single family housing starts. Of course the snow might be a factor, although few new homes are built in the northeast compared to the rest of the country. Of course D.C. is in the South region (as is Virginia), so it might be hard to tell. Here is a map of states in each region for the Census Bureau report.
There might also be an increase in speculative starts in some regions (single family) in February since many builders started a few extra homes in anticipation of the expiration of the first time home buyer tax credit. February was probably the last chance to start a spec home to take advantage of the expected buying rush in April - since the builders have to close by the end of June. It usually takes about 6 months to build a home, but 5 months is doable for smaller homes and with so many sub contractors hungry for work.
We will need to look at the details by region this time, but the general trend is sideways ...
Wednesday, February 17, 2010
Q4: Quarterly Housing Starts and New Home Sales
by Calculated Risk on 2/17/2010 06:45:00 PM
This morning the Census Bureau has released the "Quarterly Starts and Completions by Purpose and Design" report for Q4 2009.
Monthly housing starts (even single family starts) cannot be compared directly to new home sales, because the monthly housing starts report from the Census Bureau includes apartments, owner built units and condos that are not included in the new home sales report.
However it is possible to compare "Single Family Starts, Built for Sale" to New Home sales on a quarterly basis. The quarterly report shows that there were 71,000 single family starts, built for sale, in Q4 2009, and that is less than the 82,000 new homes sold for the same period. This data is Not Seasonally Adjusted (NSA).
This is the 9th consecutive quarter with homebuilders selling more homes than they start.
Note: new home sales are reported when contracts are signed, so it is appropriate to compare sales to starts (as opposed to completions). This is not perfect because homebuilders do build spec homes and many builders were stuck with some “unintentional spec homes” because of cancellations during the bust. Click on graph for larger image in new window.
This graph provides a quarterly comparison of housing starts and new home sales. In 2005, and most of 2006, starts (blue) were higher than sales (red), and inventories of new homes increased. For the last 9 quarters, starts have been below sales – and new home inventories have been falling. The second graph shows the NSA quarterly starts intent for four categories since 1975: single family built for sale, owner built (includes contractor built for owner), starts built for rent, and condos built for sale.
Condo starts in Q4 were at an all time record low of 3,000 condos built for sale. This breaks the record set in Q1, Q2 and Q3 of 2009 of 5,000 condos per quarter. The previous record was 8,000 set in Q1 1991 (data started in 1975). Only 18,000 condos were started in 2009, far below the previous low of 41,000 in 1991.
Units built for rent set an all time record low in Q4 (19,000 units in Q4 2009 compared to the previous record low of 21,000 units in Q1 1993). With the vacancy rate at a record high, the demand for new rental units will stay low for some time.
Owner built units are above the record low set in Q1 2009 (31,000 units compared to 24,000 units in Q1 2009), however the pickup in owner built starts was probably mostly seasonal (this is NSA data).
And the largest category - starts of single family units, built for sale - was very low at 71,000 units in Q4.
With starts so low in every category, the number of units added to the housing stock in 2010 will be at a record low - and that will help reduce the significant excess inventory of housing units.
Housing Starts, Vacant Units and the Unemployment Rate
by Calculated Risk on 2/17/2010 12:29:00 PM
The following two graphs are updates from previous posts with the housing start data released this morning.
The following graph shows total housing starts and the percent vacant housing units (owner and rental) in the U.S. Note: this is a combined vacancy rate based on the Census Bureau vacancy rates for owner occupied and rental housing through Q4 2009. Click on graph for larger image in new window.
Notice that total starts are not rebounding quickly as a number of analysts expected. Instead starts have moved sideways for the last eight months.
It is very unlikely that there will be a strong rebound in housing starts with a near record number of vacant housing units.
The vacancy rate has continued to climb even after housing starts fell off a cliff. Initially this was because of a significant number of completions. Also some hidden inventory (like some 2nd homes) have become available for sale or for rent, and lately some households have probably doubled up because of tough economic times. The second graph shows single family housing starts and unemployment (inverted). (The first graph shows total housing starts)
You can see both the correlation and the lag. The lag is usually about 12 to 18 months, with peak correlation at a lag of 16 months for single unit starts. The 2001 recession was a business investment led recession, and the pattern didn't hold.
This suggests unemployment might peak in Summer 2010 since housing starts bottomed in April 2009. However, since I expect the housing recovery to be sluggish, I also expect unemployment to remain high throughout 2010.
Housing Starts increase Slightly in January
by Calculated Risk on 2/17/2010 08:30:00 AM
 Click on graph for larger image in new window.
Total housing starts were at 591 thousand (SAAR) in January, up 2.8% from the revised December rate, and up 24% from the all time record low in April 2009 of 479 thousand (the lowest level since the Census Bureau began tracking housing starts in 1959). Starts had rebounded to 590 thousand in June, and have moved mostly sideways for eight months.
Single-family starts were at 484 thousand (SAAR) in January, up 1.5% from the revised December rate, and 36% above the record low in January and February 2009 (357 thousand). Just like for total starts, single-family starts have been at about this level for eight months.
Here is the Census Bureau report on housing Permits, Starts and Completions.
Housing Starts:It is important to note that many home builders started a few extra spec homes in January hoping to have them completed and sold before the home buyer tax credit expires. It takes about six months to build an average home, so the builders couldn't wait to start construction until the expected buying rush in April since they have to close by the end of June.
Privately-owned housing starts in January were at a seasonally adjusted annual rate of 591,000. This is 2.8 percent (±11.5%)* above the revised December estimate of 575,000 and is 21.1 percent (±12.3%) above the January 2009 rate of 488,000.
Single-family housing starts in January were at a rate of 484,000; this is 1.5 percent (±11.3%)* above the revised December figure of 477,000.
Housing Completions:
Privately-owned housing completions in January were at a seasonally adjusted annual rate of 659,000. This is 12.4 percent (±7.8%) below the revised December estimate of 752,000 and is 15.3 percent (±10.5%) below the January 2009 rate of 778,000.
Single-family housing completions in January were at a rate of 427,000; this is 12.9 percent (±7.1%) below the revised December rate of 490,000.
As I've noted before, this low of starts is both good news and bad news. The good news is the excess housing inventory is being absorbed - a necessary step for housing (and the economy) to recover.
The bad news is economic growth will probably be sluggish - and unemployment elevated - until residential investment picks up.
Wednesday, January 20, 2010
Housing Starts Decline in December
by Calculated Risk on 1/20/2010 08:30:00 AM
 Click on graph for larger image in new window.
Total housing starts were at 557 thousand (SAAR) in December, down 4.0% from the revised November rate, and up 16% from the all time record low in April of 479 thousand (the lowest level since the Census Bureau began tracking housing starts in 1959). Starts had rebounded to 590 thousand in June, and have moved mostly sideways for seven months.
Single-family starts were at 456 thousand (SAAR) in December, down 6.9% from the revised November rate, and 28 percent above the record low in January and February (357 thousand). Just like for total starts, single-family starts have been at around this level for seven months.
Here is the Census Bureau report on housing Permits, Starts and Completions.
Housing Starts:As I've noted before, this is both good news and bad news. The good news is the low level of starts means the excess housing inventory is being absorbed - a necessary step for housing (and the economy) to recover.
Privately-owned housing starts in December were at a seasonally adjusted annual rate of 557,000. This is 4.0 percent (±9.3%)* below the revised November estimate of580,000, but is 0.2 percent (±11.5%)* above the December 2008 rate of 556,000.
Single-family housing starts in December were at a rate of 456,000; this is 6.9 percent (±8.5%)* below the revised November figure of 490,000.
Housing Completions:
Privately-owned housing completions in December were at a seasonally adjusted annual rate of 768,000. This is 11.2 percent (±13.6%)* below the revised November estimate of 865,000 and is 25.3 percent (±8.6%) below the December 2008 rate of 1,028,000.
Single-family housing completions in December were at a rate of 503,000; this is 11.1 percent (±10.2%) below the revised November rate of 566,000.
The bad news is economic growth will probably be sluggish - and unemployment elevated - until residential investment picks up.


