 RSS Feed
 by Calculated Risk on 4/09/2010 02:15:00 PM
Showing posts with label Construction Employment. Show all posts
Showing posts with label Construction Employment. Show all posts
Friday, April 09, 2010
The Housing Bust and Construction Employment
Back in 2006 some analysts argued that strong local economies (because of construction) would keep certain areas from being impacted by the housing bust. I disagreed and wrote:
As the housing bubble unwinds, housing related employment will fall; and fall dramatically in areas like the Inland Empire. The more an area is dependent on housing, the larger the negative impact on the local economy will be.Here is an update to one of the graphs I posted in 2006 (data is not seasonally adjusted):
So I think some pundits have it backwards: Instead of a strong local economy keeping housing afloat, I think the bursting housing bubble will significantly impact housing dependent local economies.
 Click on graph for larger image in new window.
This graph shows the percentage of construction payroll jobs in three areas of California: San Diego, Riverside (Inland Empire), and Sacramento. The California percentages exclude the three metropolitan areas.
Sure enough, generally the areas with the largest price declines and total lost jobs, were the areas with the highest percentage of construction employment during the boom. As an example, total employment in the Inland Empire is off 14.3% compared to 10.4% for all of California.
I also took a look at some of the Case-Shiller cities. The next graph shows the price declines from the peak for each city included in S&P/Case-Shiller indices (NSA).
 Unfortunately the BLS doesn't break out construction employment for Denver, Dallas or Charlotte (the cities with the smallest Case-Shiller house price declines).
 So I compared Boston (4th smallest price decline) with Las Vegas and Phoenix with the largest price declines. I added Texas because of the minimal housing bust in that state.
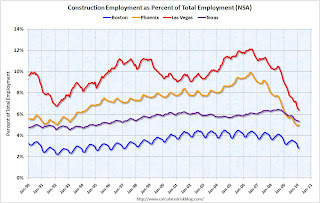 Sure enough - the cities with the highest level of construction employment were hit the hardest. Boston has a fairly low percentage of construction jobs and a fairly mild bust. In Texas there are a fair number of construction jobs, but there wasn't a huge surge in construction (construction in Texas is probably heavily commercial).
In Las Vegas total employment is down 14.6%, and in Phoenix employment is off 12.9%, but in Boston total employment only declined 7% - and only 4.9% in Texas.
This was all part of the cycle. Rising prices meant more home construction - and more construction meant more construction employment and that meant more homebuyers. When the bust came, many of these workers lost their jobs, and then their homes, and that put additional pressure on the local housing markets. So it was pretty easy to tell in 2006 which areas would get crushed.
Friday, March 05, 2010
Diffusion Index and Temporary Help
by Calculated Risk on 3/05/2010 11:24:00 AM
First - David Leonhardt at the NY Times Economix asks: Is the Recovery Losing Steam?
How you view today’s jobs report depends on snow.We won't know which "snow" view is correct for another month - or maybe even months.
...
If the storms indeed had a big effect — if they cut even 100,000 jobs from payrolls — then today’s report counts as very good news.
...
If the snow effect was close to zero ... the recovery is losing steam — as the peak impact of the stimulus is now past and consumers and businesses still aren’t spending aggressively.
Which of these two situations — the optimistic or pessimistic one — is more plausible? You’ll hear a lot of strong arguments today, but no one really knows. The uncertainty about the snow effect is too big, as the Labor Department did a nice job of acknowledging.
My guess is that recovery has indeed lost some steam in the last couple of months.
But here are a couple more graphs based on data in the employment report - and both of these are little more positive ...
Temporary Workers
From the BLS report:
In February, temporary help services added 48,000 jobs. Since reaching a low point in September 2009, temporary help services employment has risen by 284,000.
 This graph is a little complicated.
The red line is the three month average change in temporary help services (left axis). This is shifted four months into the future.
The blue line (right axis) is the three month average change in total employment (excluding temporary help services).
Unfortunately the data on temporary help services only goes back to 1990, but it does appear that temporary help leads employment by about four months. When we discussed this graph last year, temporary help suggested positive job growth in December 2009. But with revisions - the graph has been shifted a few months.
The thinking is that before companies hire permanent employees following a recession, employers will first increase the hours worked of current employees and also hire temporary employees. Since the number of temporary workers increased sharply, some people think this might be signaling the beginning of an employment recovery.
However, there has been some evidence of a shift by employers to more temporary workers, and the saying may become "We are all temporary now!", so use this increase with caution. For more, including some cautionary comments from a BLS economist on using temporary help, see Tom Abate's article in the San Francisco Chronicle.
Also - the temporary hiring for the Census should probably be excluded from this graph in the future (remember the Census will boost payroll jobs by maybe 100 thousand in March, and up to 500 thousand in May - but all those jobs will be lost over the following 6 months).
Diffusion Index
 The BLS diffusion index for total private employment increased to 48.0 from 44.2 in January. This is the highest level since March 2008.
For manufacturing, the diffusion index is at 54.9, the first time above 50 since November 2007.
Think of this as a measure of how widespread job losses are across industries. The further from 50 (above or below), the more widespread the job losses or gains reported by the BLS. From the BLS:
Figures are the percent of industries with employment increasing plus one-half of the industries with unchanged employment, where 50 percent indicates an equal balance between industries with increasing and decreasing employment.The diffusion index had been trending up, meaning job losses are becoming less widespread.
However a reading of 48.0 is still below the balance level, and I'd expect the diffusion index to be at or above 50 when the economy starts adding net jobs.
Earlier employment posts today:
Saturday, February 06, 2010
Construction Employment Outlook
by Calculated Risk on 2/06/2010 03:57:00 PM
TIME asks: The Great Recession: Will Construction Workers Survive?
Nationally, unemployment fell to 9.7% in January, but in construction it jumped to 24.7% ... "In the previous 14 years, I had not been out of work for more than one week," says Pat O'Connor, 57, a Connecticut carpenter. With no work since July, O'Connor says, "It is a bad dream turning into a nightmare. Is construction dead? It's just horrible right now. No one expected this. It's a depression."And it won't get better in 2010.
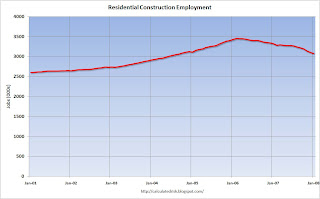
The following graph shows construction employment (total) and as a percent of non-farm payroll employment.
 Click on graph for larger image in new window.
Although construction employment is off 2.1 million workers since the peak, there will be no increase any time soon.
Looking at the graph, it appears construction employment continues to decline for a time after a recession ends - or only picks up a little. However this masks the contributions from the two components of construction: residential and non-residential.
Residential investment (and residential construction) usually leads the economy out of recession, and non-residential construction lags the economy. Unfortunately the BLS didn't start breaking out residential construction employment until recently, but that is the pattern.
This time any improvement in residential construction employment will be small, in fact completions in 2010 will be at an all time record low (see: Housing Stock and Flow).
The TIME article notes:
In downtown Los Angeles, just east of Little Tokyo, one of the only active construction sites is a 53-unit apartment building at Alameda and 4th Street.And when that is completed, the opportunities will be few. In 2010 the number of 5+ unit completions will collapse:
 The blue line is for multifamily starts and the red line is for multifamily completions. For the most part, all the multifamily units that will be delivered in 2010 have already been started since, according to the Census Bureau, it takes on average over 1 year to complete these projects.
Since multifamily starts collapsed in 2009, completions will collapse in 2010 - and construction employment will suffer.
And non-residential investment (and employment) is still getting crushed (see: Q4: Office, Mall and Lodging Investment). As these projects are completed, more construction workers will be let go.
So the outlook for construction employment in 2010 is grim.
Saturday, October 03, 2009
NY Times: Retailers Expect No Growth in Holiday Spending
by Calculated Risk on 10/03/2009 01:43:00 PM
From the NY Times: Retailers Expect Flat Christmas Sales This Year
[A] lot of people are thinking about it, and taking surveys to test the mood of the American consumer, and deciding that this Christmas will be as bad as last — which is to say, one of the worst on record.And that suggests that seasonal retail hiring will be weak too. Here is a repeat of a graph from a post a couple weeks ago: Seasonal Retail Hiring
Retailers are relieved to hear that prediction. Flat sales this holiday season would at least mean that things had stopped getting worse ... several reports published in the last few days, including surveys by Nielsen and Deloitte, forecast no change in holiday sales from last year to this year.
Typically retail companies start hiring for the holiday season in October, and really increase hiring in November. This graph shows the historical net retail jobs added for October, November and December by year.
 Click on graph for larger image in new window.
This really shows the collapse in retail hiring in 2008. This also shows how the season has changed over time - back in the '80s, retailers hired mostly in December. Now the peak month is November, and many retailers start hiring seasonal workers in October.
Given the expectation of no growth in holiday spending, retailers will probably be very cautious hiring again this year.
Saturday, April 11, 2009
CRE Bust: A Hole in the Ground
by Calculated Risk on 4/11/2009 06:56:00 PM
From The Oregonian: Construction of downtown Portland high-rise is halted by tight credit (ht Shawn, Justin, Neil)
Tom Moyer, one of Portland's most successful real estate developers, will halt work Monday on his 32-floor tower now under construction in downtown Portland.This article makes several key points:
Moyer's decision to pull 350 workers off the Park Avenue West is a stunning sign that no city, no person and no block is spared from this recession.
... The building, originally scheduled to open in 2011, already was more than half leased by a law firm and a Nike store.
...
At the job site Friday, the concrete, mechanical and iron workers left the site about 3 p.m. with the building 15 percent finished. It remains just a parking garage, frozen for now about three floors below ground.
...
[Vanessa Sturgeon, president of TMT Development] said she expects construction to remain stopped until they can find financing in early 2010. They'll use the time to redesign the building and lop off the top 10 stories that were to be "ultra-luxury" condos.
...
Carpenter Steve Callopy said he has no safety net beyond unemployment compensation and doesn't see any fresh work on the horizon. Commercial construction, in particular, seems to have fallen apart.
"Do you see any commercial stuff going on?" he said. "I see a lot of commercial 'For Lease' signs."
Friday, March 20, 2009
California Unemployment Rate Rises to 10.5% in February
by Calculated Risk on 3/20/2009 12:52:00 PM
From the LA Times: California unemployment hits 10.5% in February
California's unemployment rate rose for the 11th straight month in February, hitting 10.5% as a recession-wracked economy shed 116,000 jobs across all professions and industries, the state reported today.The unemployment rate in California peaked at 11% in the early '80s.
The number is up from 10.1% in January and is the highest since April 1983.
Here is the EDD report. Construction employment is off 18.5% from Feb '08 to Feb '09. This is over 155,000 construction jobs lost in California alone over the last 12 months.
Monday, January 19, 2009
Inland Empire and Construction Employment
by Calculated Risk on 1/19/2009 12:09:00 PM
Bloomberg has an article on the Inland Empire: California Finds Public-Works Spending No Unemployment Cure-All. The focus of the article is on public works projects, but the more important point is that areas with the highest levels of construction employment during the housing boom are now suffering the most from unemployment (no surprise!).
Only four years ago, Riverside and nearby San Bernardino, often called the Inland Empire, were California’s economic powerhouse, accounting for more than a fifth of the state’s new jobs. Today, unemployment reigns in the sprawling region east of Los Angeles. The 9.5 percent jobless rate in the two counties matches Detroit’s as the highest of any major metropolitan area in the U.S.
 Click on graph for larger image in new window.
This graph (using Not Seasonally Adjusted data) shows construction as a percent of total employment for the Inland Empire, California and the U.S.
Although there was a surge in construction employment in the U.S., and about a 50% increase in California (as a percent of total employment), construction employment doubled (as a percent of total employment) in the Inland Empire.
 The second graph shows the percent of construction employment and the unemployment rate for the Inland Empire.
With the housing bust, the percent construction employment has declined sharply and the unemployment rate has risen to almost 10%. Is it any surprise that jobless rate in the Inland Empire matches Detroit’s as the highest of any major metropolitan area in the U.S.?
Monday, November 24, 2008
Construction Employment and the Obama Stimulus Package
by Calculated Risk on 11/24/2008 11:09:00 PM
One of the key elements of the Obama stimulus package is infrastructure investment.
From the WSJ: Construction Industry Is Poised for a Rebound
The construction industry, beset by one of the biggest drops in employment in the current economic downturn, could be poised for a rebound under President-elect Barack Obama's expected stimulus package.I don't think the plan is to have a rebound in construction employment, but to cushion the blow of the 2nd wave of construction job losses coming in 2009. Most of the construction job losses so far have been in residential construction, but the 2009 construction job losses will be related to the end of the commercial real estate boom.
 Click on graph for larger image in new window.
This graph shows construction employment as a percent of the civilian labor force. Even though construction employment has declined as a percent of the workforce, construction employment is still higher than the normal level. This is because the commercial real estate boom has kept many construction workers employed, mostly working on hotels, malls and office buildings.
However non-residential investment is now hitting the wall.
 The second graph shows the Architecture Billings Index is at a record low.
There is "an approximate nine to twelve month lag time between architecture billings and construction spending", so we should expect the first decline in architecture billing to impact non-residential structure investment in Q4 2008, and a further downturn in non-residential construction activity next summer.
The Obama stimulus plan is intended to somewhat offset this coming slowdown in non-residential investment.
From the WSJ article:
From highways to schools, state and local governments have been postponing approved construction projects in recent months. Assured funding would jump-start these projects. The American Association of State Highway and Transportation Officials, a group of state and local government officials, has a list of 3,109 "ready-to-go" highway projects that could break ground in 30 days to 90 days worth $18.4 billion.Back in May I estimated the decrease in non-residential investment for malls, offices and lodging alone at about $60 billion in 2009. So I don't think $18.4 billion is anywhere near enough to offset the probable decline in 2009 non-residential investment.
Two former Clinton administration transit officials, Mortimer Downey and Jane Garvey, are among those spearheading transportation issues for the Obama transition. They have reached out to state and local officials to be ready for a spending package.
Saturday, November 22, 2008
Unemployment Hits the Inland Empire Hard
by Calculated Risk on 11/22/2008 03:33:00 PM
Please indulge me ...
Back in 2005, I wrote:
Of all the areas experiencing a housing boom, the areas most at risk have had the greatest increase in real estate related jobs. These jobs include home construction, real estate agents, mortgage brokers, inspectors and more. ... I believe that areas like the Inland Empire will suffer the most when housing activity slows.And in 2006, in response to a sanguine forecast from a local economist, I wrote: Housing: Inverted Reasoning?
[W]hat happens during a housing bust? Just look at the unemployment rate in the previous bust.And from the LA Times today: Surge in unemployment puts California's Inland Empire in tailspin
The unemployment rate in California rose from 5.2% to 10.4% in just over two years. For the Inland Empire, the unemployment rate rose from 4.8% to double digits in the same period, peaking at 12.4%. Yes, California was impacted by Defense cutbacks in the early '90s, but the areas that were most dependent on housing saw the largest increases in the unemployment rate.
As the housing bubble unwinds, housing related employment will fall; and fall dramatically in areas like the Inland Empire. The more an area is dependent on housing, the larger the negative impact on the local economy will be.
So I think some pundits have it backwards: Instead of a strong local economy keeping housing afloat, I think the bursting housing bubble will significantly impact housing dependent local economies.
If the Inland Empire is one of the birthplaces of the current recession, it is also at the forefront of the nation's growing pain over joblessness -- with the highest unemployment rate of any large metropolitan area in the country.Hoocoodanode?
State numbers released Friday show the Riverside, San Bernardino and Ontario area is now suffering from its highest unemployment rate in 13 years at 9.5% in October -- 3 percentage points higher than the national rate and 1.3 points higher than the state's rate of 8.2%.
Ignited by the collapse of the local housing market, which decimated the construction and lending industries, the wave of unemployment has trickled into almost every area, including retail, manufacturing and local government.
Friday, November 07, 2008
Construction and Retail Employment
by Calculated Risk on 11/07/2008 03:51:00 PM
A couple more graphs on employment ...
Click on graph for larger image in new window.
The first graph shows employment for residential and non-residential employment. Note: the y-axis doesn't start at zero to better show the change.
Residential construction is off about 600 thousand from the peak, but that doesn't include cash workers (many illegal immigrants) and some construction workers work in both residential and non-residential areas and are included in the non-residential category.
Non-residential construction employment is off 180 thousand from the peak. With the coming slump in commercial real estate (CRE), we will probably see some significant construction job losses over the next year. The second graph shows the year-over-year employment for retail. Retail employment growth has been sluggish in recent years (probably because of internet sales and more efficiency).
YoY employment is off 1.8% - close to the slump in 2001/2002. In 1991, YoY retail employment slumped by 2.5%.
A few weeks ago, the LA Times reported: Retailers cutting back on holiday hiring
A recent survey of more than 1,000 managers responsible for hiring hourly workers found that each manager planned on hiring an average of 3.7 seasonal employees this year, roughly 33% less than the 5.6 workers they hired during last year's holiday period.Retail employment could be really grim over the holiday season.
Tuesday, June 17, 2008
Housing Completions and Residential Construction Employment
by Calculated Risk on 6/17/2008 12:30:00 PM
This graph is an update to the construction employment conundrum: completions have declined about 50% from the peak in 2006, and yet residential construction employment has declined about 500,000 jobs or about 15%. Click on graph for larger image in new window.
Note that starts are shifted 6 months into the future since it takes a little over 6 months to complete a typical residential unit.
Many observers believe the difference in the percentage declines is because of uncounted illegal immigrants in the construction work force.
The uncounted illegal immigrant argument is important for the impact on the economy, but it doesn't seem to explain why the BLS employment numbers haven't fallen more. Although the BLS is missing the job losses for illegal workers on the way down, they also didn't count them on the way up either.
Here are two other possible explanations for the different percentage declines:
We will know more are CRE construction slumps in the 2nd half of 2008.
Wednesday, June 04, 2008
The Residential Construction Employment Puzzle
by Calculated Risk on 6/04/2008 08:00:00 PM
An article in the WSJ today reminded me of the residential construction employment conundrum. From the WSJ: Housing Slump Hits Hispanic Workers, But Most Immigrants Remain in U.S.
The housing slump has disproportionately hurt Hispanic workers, provoking a jump in unemployment that has hit the immigrants among them the hardest, according to a new study.Here is the report: Latino Labor Report, 2008: Construction Reverses Job Growth for Latinos
...
Many undocumented workers don't appear on employment rosters because they work as independent contractors or are hired indirectly by big developers through subcontractors or labor brokers who don't officially hire every worker. "They were ghosts to begin with," says Rose Quint, an economist at the National Association of Homebuilders. Thus, she says, "the decline in employment is probably bigger than numbers are showing."
This graph shows the construction employment conundrum: why have starts and completions declined about 50% from the peak in 2006, and yet residential construction employment is off only 14%?
 Click on graph for larger image in new window.
Note that starts are shifted 6 months into the future since it takes a little over 6 months to complete a typical residential unit.
Last year Greg Ip at the WSJ reviewed an analysis from Deutsche Bank economists suggesting that the illegal immigrant explanation accounts for most of the missing job losses:
[E]conomists at Deutsche Bank estimate construction employment should have fallen about 900,000 since early 2006 when in fact it’s only down 150,000. They conclude 500,000 of the unexplained gap is attributable to layoffs of illegal Hispanic workers.To update the numbers, residential construction employment is off 477,000 from the peak, but there are still close to 1 million too many jobs based on starts and completions.
The uncounted illegal immigrant argument is important for the impact on the economy, but it doesn't seem to explain why the BLS employment numbers haven't fallen more. Although the BLS is missing the job losses for illegal workers on the way down, they also didn't count them on the way up either.
Although miscounted illegal workers probably explains some of the fewer than expected BLS reported job losses, there are two other explanations that make sense:
The answer is probably a combination of all of the above.
Friday, May 02, 2008
Jobs: Nonfarm Payrolls Decline 20,000
by Calculated Risk on 5/02/2008 08:44:00 AM
From the BLS: Employment Situation Summary
Nonfarm payroll employment was little changed in April (-20,000), following job losses that totaled 240,000 in the first 3 months of the year, the Bureau of Labor Statistics of the U.S. Department of Labor reported today. The unemployment rate, at 5.0 percent, also was little changed in April. Employment continued to decline in construction, manufacturing, and retail trade, while jobs were added in health care and in professional and technical services.The first graph shows the unemployment rate and the year-over-year change in employment vs. recessions.
 Click on graph for larger image.
Unemployment was essentially unchanged, but the rise in unemployment, from a cycle low of 4.4% to 5.0% is a recession warning.
Also concerning is the YoY change in employment is barely positive (the economy has added only 460 thousand jobs in the last year), also suggesting a recession.
Note the current recession indicated on the graph is "probable", and is not official.
The second graph shows residential construction employment.
 Note: graph doesn't start at zero to better show the change.
Residential construction employment declined 31,100 in April, and including downward revisions to previous months, is down 478 thousand, or about 13.8%, from the peak in February 2006. (compared to housing starts off over 50%).
This is the fourth straight month of job losses.
Friday, April 18, 2008
California Unemployment Increases Sharply
by Calculated Risk on 4/18/2008 03:37:00 PM
From the LA Times: California unemployment hits 6.2%; worse than Ohio, Pennsylvania
California's unemployment rate rose by a whopping half a percentage point in March, reaching 6.2% as a weakening economy shed jobs in the ailing construction and financial activities sectors. In all, 1.13 million were unemployed.And on the Inland Empire, it was almost two years ago I wrote Housing: Inverted Reasoning?
...
California is doing worse than Pennsylvania and Ohio ... the two Rust Belt states that have figured prominently in the presidential primary elections because of their lost manufacturing jobs.
As the housing bubble unwinds, housing related employment will fall; and fall dramatically in areas like the Inland Empire. The more an area is dependent on housing, the larger the negative impact on the local economy will be.That seemed obvious to most of us! And now from the LA Times on unemployment in the Inland Empire:
The rise in unemployment during March affected all of Southern California, with the worst effects in the Inland Empire. The rate in Riverside County -- not seasonally adjusted -- rose to 7.4% from 7.0%, while in San Bernardino County it rose to 6.7% from 6.3%.
Friday, March 07, 2008
Construction Employment
by Calculated Risk on 3/07/2008 04:25:00 PM
One of the mysteries in 2007 was why BLS reported residential construction employment didn't decline as much as expected based on housing starts and completions.
The first graph shows residential construction employment vs. real residential investment (minus broker's commissions). Click on graph for larger image.
This shows the mystery in residential construction employment. Even though Residential Investment fell sharply, residential construction employment is only down 407.1 thousand, or about 11.8%, from the peak in February 2006.
There have been many explanations for this divergence, but part of the reason is that many construction employees shifted to commercial work, without being re categorized as non-residential employees. The second graph shows non-residential construction employment vs. real non-residential investment.
Even though investment surged through the end of 2007, reported employment lagged behind and even declined slightly in 2007. This was most likely because employees shifting to commercial construction were still being reported to the BLS as residential construction employees.
This is important in 2008 because investment in non-residential structures appears to be slowing sharply. The third graph shows total private construction employment as a percent of total private employment since 1978.
Currently construction is about 5.4% of total employment, off the recent highs (5.7%), but well above the cycle lows in '92 (4.2%) and '82 (4.4%). A decline to 4.4% over the next year or two would mean the loss of approximately 1.3 million construction jobs.
This will probably be the key area of job losses in 2008.
Jobs: Nonfarm Payrolls Decline 63,000 in February
by Calculated Risk on 3/07/2008 08:39:00 AM
From the BLS: Employment Situation Summary
Nonfarm payroll employment edged down in February (-63,000), and the unemployment rate was essentially unchanged at 4.8 percent, the Bureau of Labor Statistics of the U.S. Department of Labor reported today. Employment fell in manufacturing, construction, and retail trade. Job growth continued in health care and in food services.
 Click on graph for larger image.
Residential construction employment declined 25,700 in February, and including downward revisions to previous months, is down 407.1 thousand, or about 11.8%, from the peak in February 2006. (compared to housing starts off over 50%).
The second graph shows the unemployment rate and the year-over-year change in employment vs. recessions.

Although unemployment was slightly lower - as people leave the workforce - the rise in unemployment, from a cycle low of 4.4% to 4.8% is a recession warning.
Also concerning is the YoY change in employment is less than 1%, also suggesting a recession.
Overall this is a weak report.
Friday, February 01, 2008
Jobs: Nonfarm payrolls fell 17,000 in January
by Calculated Risk on 2/01/2008 09:40:00 AM
From the BLS: Employment Situation Summary
Both nonfarm payroll employment, at 138.1 million, and the unemployment rate, at 4.9 percent, were essentially unchanged in January, the Bureau of Labor Statistics of the U.S. Department of Labor reported today. The small January movement in nonfarm payroll employment (-17,000) reflected declines in construction and manufacturing and job growth in health care.
 Click on graph for larger image.
Residential construction employment declined 28,100 in December, and including downward revisions to previous months, is down 375.3 thousand, or about 10.9%, from the peak in February 2006. (compared to housing starts off about 50%).
The second graph shows the unemployment rate and the year-over-year change in employment vs. recessions.

Although unemployment was slightly lower, the rise in unemployment, from a cycle low of 4.4% to 4.9% is a recession warning.
Also concerning is the YoY change in employment is less than 1%, also suggesting a recession.
Overall this is a very weak report, especially including the downward revisions to prior months (although December was revised up).
Friday, January 04, 2008
December Employment Report
by Calculated Risk on 1/04/2008 08:31:00 AM
Update: This graph shows the unemployment rate and the year-over-year change in employment vs. recessions. Click on graph for larger image.
The rise in unemployment, from a cycle low of 4.4% to 5.0% will set off alarm bells.
Also concerning is the YoY change in employment is less than 1%, also suggesting a recession.
Employment numbers can be heavily revised, but this report will definitely get attention.
Original Post: From the BLS: Employment Situation Summary
The unemployment rate rose to 5.0 percent in December, while nonfarm payroll employment was essentially unchanged (+18,000), the Bureau of Labor Statistics of the U.S. Department of Labor reported today. Job growth in several service-providing industries, including professional and technical services, health care, and food services, was largely offset by job losses in construction and manufacturing. Average hourly earnings rose by 7 cents, or 0.4 percent.
 Click on graph for larger image.
Residential construction employment declined 28,500 in December, and including downward revisions to previous months, is down 293.1 thousand, or about 8.5%, from the peak in March 2006. (compared to housing starts off almost 50%).
Note the scale doesn't start from zero: this is to better show the change in employment.
 This second graph shows starts, completions and residential construction employment. (starts are shifted 6 months into the future). Completions and residential construction employment were highly correlated, and Completions typically lag Starts by about 6 months.
This suggests residential construction employment could fall significantly from current levels.
Overall this is a very weak report, and the unemployment rate rising to 5% will set off recession arguments.
Tuesday, November 20, 2007
Housing Starts and Completions for October
by Calculated Risk on 11/20/2007 08:39:00 AM
The Census Bureau reports on housing Permits, Starts and Completions.
Seasonally adjusted permits fell sharply:
Privately-owned housing units authorized by building permits in October were at a seasonally adjusted annual rate of 1,178,000. This is 6.6 percent below the revised September rate of 1,261,000 and is 24.5 percent below the revised October 2006 estimate of 1,560,000.Starts were up:
Privately-owned housing starts in October were at a seasonally adjusted annual rate of 1,229,000. This is 3.0 percent above the revised September estimate of 1,193,000, but is 16.4 percent below the revised October 2006 rate of 1,470,000.And Completions were up:
Privately-owned housing completions in October were at a seasonally adjusted annual rate of 1,436,000. This is 1.9 percent above the revised September estimate of 1,409,000, but is 25.2 percent below the revised October 2006 rate of 1,919,000.
 Click on graph for larger image.
Here is a long term graph of starts and completions. Completions follow starts by about 6 to 7 months.
The small increase in starts is just noise. With permits falling, starts will continue to fall in coming months. With record inventories, this report shows that the builders are still starting too many homes.
More interesting: Look at what is about to happen to completions:
 This second graph shows starts, completions and residential construction employment. (starts are shifted 6 months into the future). Completions and residential construction employment were highly correlated, and Completions typically lag Starts by about 6 months.
Completions were at a 1.436 million rate in October, but are about to follow starts down to the 1.2 million level. I'd expect completions to fall rapidly over the next few months, impacting residential construction employment.
Note: there are many reasons why the BLS reported employment hasn't fallen as far as expected (blue line), but with completions falling further over the next few months - and commercial real estate activity slowing - I'd expect to see significant declines in construction employment soon.
Monday, November 12, 2007
Residential Construction Employment Update
by Calculated Risk on 11/12/2007 12:10:00 PM
According to the BLS, residential construction employment has only declined 6.5% from the peak employment in 2006 (221,900 fewer jobs). This is surprising because housing completions are off about 37% from the peak.  Click on graph for larger image.
This graph shows starts, completions and residential construction employment. (starts are shifted 6 months into the future). Completions and residential construction employment were highly correlated, and Completions typically lag Starts by about 6 months.
The puzzle is why residential construction employment hasn't fallen further.
The following article from the Beaufort Gazette provides some clues: Housing meltdown hammers construction industry
Beekman Webb put a classified advertisement in the newspaper a couple of weeks ago for a carpenter's assistant and "had about 50 calls in three days."This hits on two of the explanations for the residential construction employment puzzle: many workers have moved to commercial work (note that Neal has moved from 20% percent commercial to 60% commercial), and many workers are underemployed.
"I was just covered up, and I was the only ad in the paper at the time looking for carpentry help," said Webb, who has his own Beaufort-based construction company.
"I had people from Hilton Head (Island) that told me they'd been in business for 15 years with a bunch of employees and now they're just looking for a job as a carpenter," he said.
The housing market slump has had a trickle-down effect on the area's residential construction industry, according to local builders. Gerald Neal, owner of Neal's Construction in Beaufort, first noticed the slowdown earlier this year.
"It's real tough times for those guys -- the (residential construction) subcontractors. They're having a rough time," he said.
The local commercial construction industry has not been hit quite as hard, according to Neal, which has made him change the way he operates his business.
"I used to do 20 percent commercial. Today, I do about 60 percent commercial, 40 (percent) residential," Neal said.
Other possible reasons for the employment puzzle are that the BLS has not correctly accounted for illegal immigrants working in the construction industry, and the BLS Birth/Death model might have missed the turning point in residential construction employment.
There is some merit to to all of these arguments, and I think the answer will be some combination of these explanations. The concern now is that if commercial construction spending slows, as appears likely from the recent Fed loan survey, then workers that have moved to commercial construction will have no work opportunities.
This was the concern expressed by the director of forecasting of the NAHB in August. From Reuters: Construction job losses could top 1 million
"The ability of nonresidential to continue absorbing additional workers is going to be limited, and that's going to put downward pressure on construction employment overall," [Bernard Markstein, director of forecasting at the National Association of Home Builders] said, adding that cuts may be deeper than in the 1990s.


