 RSS Feed
 by Calculated Risk on 5/30/2022 10:06:00 AM
Monday, May 30, 2022
Housing Inventory May 30th Update: Inventory UP 5.7% Week-over-week
Altos reports inventory is up 11.4% year-over-year.
Inventory usually declines in the winter, and then increases in the spring. Inventory bottomed seasonally at the beginning of March 2022 and is now up 51% since then.
 Click on graph for larger image in graph gallery.
This inventory graph is courtesy of Altos Research.
As of May 27th, inventory was at 364 thousand (7-day average), compared to 344 thousand the prior week. Inventory was up 5.7% from the previous week.
Inventory is still very low. Compared to the same week in 2021, inventory is up 11.4% from 327 thousand, however compared to the same week in 2020 inventory is down 49.4% from 719 thousand. Compared to 3 years ago, inventory is down 61.6% from 948 thousand.
Inventory is still very low. Compared to the same week in 2021, inventory is up 11.4% from 327 thousand, however compared to the same week in 2020 inventory is down 49.4% from 719 thousand. Compared to 3 years ago, inventory is down 61.6% from 948 thousand.
Here are the inventory milestones I’m watching for with the Altos data:
1. The seasonal bottom (happened on March 4th for Altos) ✅
2. Inventory up year-over-year (happened on May 13th for Altos) ✅
3. Inventory up compared to two years ago (currently down 49.4% according to Altos)
4. Inventory up compared to 2019 (currently down 61.6%).
1. The seasonal bottom (happened on March 4th for Altos) ✅
2. Inventory up year-over-year (happened on May 13th for Altos) ✅
3. Inventory up compared to two years ago (currently down 49.4% according to Altos)
4. Inventory up compared to 2019 (currently down 61.6%).

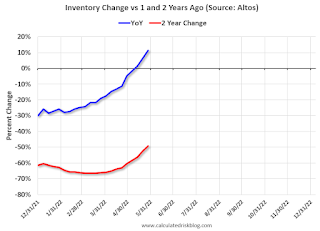
Here is a graph of the inventory change year-over-year and vs two years ago (milestone 3 above).
The blue line is the year-over-year data, and the red line is compared to two years ago.
Two years ago (in 2020) inventory was declining all year, so the two-year comparison will get easier all year.
Mike Simonsen discusses this data regularly on Youtube.


