 RSS Feed
 by Calculated Risk on 4/21/2022 12:04:00 PM
Thursday, April 21, 2022
Final Look at Local Housing Markets in March and Housing Inventory Milestones to Watch
Today, in the Calculated Risk Real Estate Newsletter: Final Look at Local Housing Markets in March
A brief excerpt:
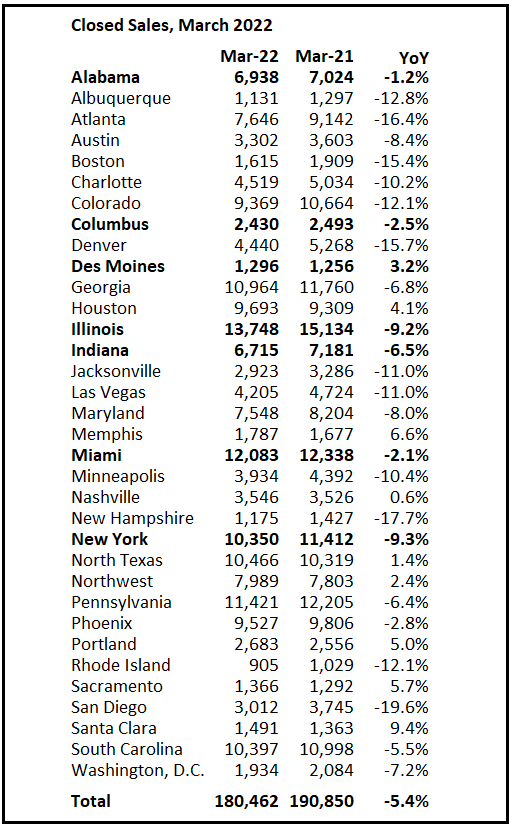
This final update for March adds Alabama, Columbus, Des Moines, Illinois, Indiana, Miami and New York.There is much more in the article.
...
Housing Inventory Milestones to Watch
1. The seasonal bottom.
2. Inventory up year-over-year (currently down 9.5% according to NAR)
3. Inventory up compared to two years ago (currently down 36%)
4. Inventory back to median for last decade (currently down 43%)
So far #1 has happened, and #2 will probably happen mid-year 2022. The following graph (using NAR inventory data) shows the above changes since January 2020. Even when inventory is up YoY (that will happen soon), we will still be a long way from normal levels of inventory.
I will discuss house prices vs. inventory next week after the Case-Shiller house price index is released.
...
Closed Sales in March
And a table of March sales. Sales in these areas were down 5.4% YoY, Not Seasonally Adjusted (NSA). Sales were up YoY in about 30% of these markets. The NAR reported sales NSA in March (456,000) were 5.8% below sales in March 2021 (484,000). So, this sample of local markets is similar to the NAR report.
The table doesn’t include California where sales were down 4.4% year-over-year.
Notes for all tables:
1) New additions to table in BOLD.
2) Northwest (Seattle), North Texas (Dallas) and Santa Clara (San Jose), Jacksonville, Source: Northeast Florida Association of REALTORS®
3) Totals do not include Atlanta or Denver (included in state totals).

You can subscribe at Calculated Risk Real Estate Newsletter (most content is free without ads).


