 RSS Feed
 by Calculated Risk on 3/10/2022 02:08:00 PM
Thursday, March 10, 2022
Fed's Flow of Funds: Household Net Worth Increased $5.3 Trillion in Q4
The Federal Reserve released the Q4 2021 Flow of Funds report today: Financial Accounts of the United States.
The net worth of households and nonprofits rose to $150.3 trillion during the fourth quarter of 2021. The value of directly and indirectly held corporate equities increased $2.5 trillion and the value of real estate increased $1.5 trillion.
...
Household debt increased 8 percent at an annual rate in the fourth quarter of 2021. Consumer credit grew at an annual rate of 6.9 percent, while mortgage debt (excluding charge-offs) grew at an annual rate of 8 percent.
 Click on graph for larger image.
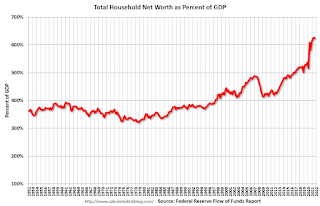
The first graph shows Households and Nonprofit net worth as a percent of GDP.
With the sharp decline in GDP in Q2 2020, net worth as a percent of GDP increased sharply, and then declined somewhat. But now net worth as a percent of GDP is at a new all-time high.
This includes real estate and financial assets (stocks, bonds, pension reserves, deposits, etc) net of liabilities (mostly mortgages). Note that this does NOT include public debt obligations.
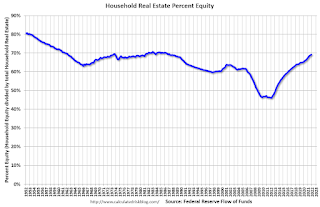 This graph shows homeowner percent equity since 1952.
Household percent equity (as measured by the Fed) collapsed when house prices fell sharply in 2007 and 2008.
In Q4 2021, household percent equity (of household real estate) was at 69.2% - up from 68.8% in Q3 This is the highest percent equity since the 1980s.
Note: about 30.3% of owner occupied households had no mortgage debt as of April 2010. So, the approximately 50+ million households with mortgages have less than 67.7% equity - and about 1.1 million homeowners still have negative equity.
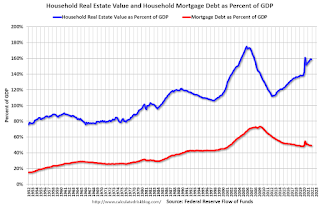 The third graph shows household real estate assets and mortgage debt as a percent of GDP. Note this graph was impacted by the sharp decline in Q2 2020 GDP.
Mortgage debt increased by $245 billion in Q4. This is the largest quarterly increase in mortgage debt since 2006.
Mortgage debt is up $1.05 trillion from the peak during the housing bubble, but, as a percent of GDP is at 48.9% - down from Q2 - and down from a peak of 73.3% of GDP during the housing bubble.
The value of real estate, as a percent of GDP, increased in Q4, and is well above the average of the last 30 years.
This graph shows homeowner percent equity since 1952. Household percent equity (as measured by the Fed) collapsed when house prices fell sharply in 2007 and 2008.
In Q4 2021, household percent equity (of household real estate) was at 69.2% - up from 68.8% in Q3 This is the highest percent equity since the 1980s.
Note: about 30.3% of owner occupied households had no mortgage debt as of April 2010. So, the approximately 50+ million households with mortgages have less than 67.7% equity - and about 1.1 million homeowners still have negative equity.
The third graph shows household real estate assets and mortgage debt as a percent of GDP. Note this graph was impacted by the sharp decline in Q2 2020 GDP.Mortgage debt increased by $245 billion in Q4. This is the largest quarterly increase in mortgage debt since 2006.
Mortgage debt is up $1.05 trillion from the peak during the housing bubble, but, as a percent of GDP is at 48.9% - down from Q2 - and down from a peak of 73.3% of GDP during the housing bubble.
The value of real estate, as a percent of GDP, increased in Q4, and is well above the average of the last 30 years.


