 RSS Feed
 by Calculated Risk on 1/21/2022 11:59:00 AM
Friday, January 21, 2022
Hotels: Occupancy Rate Down 16% Compared to Same Week in 2019
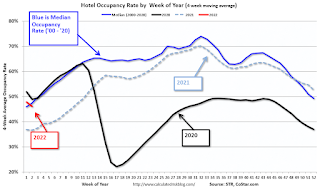
U.S. weekly hotel occupancy worsened in comparison with pre-pandemic levels, according to STR‘s latest data through Jan. 15.The following graph shows the seasonal pattern for the hotel occupancy rate using the four week average.
January 9-15, 2022 (percentage change from comparable week in 2019*):
• Occupancy: 48.8% (-16.3%)
• Average daily rate (ADR): $122.12 (-1.6%)
• Revenue per available room (RevPAR): $54.47 (-19.0%)
On an absolute basis, occupancy was higher than the previous week, but the gap to 2019 levels widened, pointing to a larger impact from the omicron variant. ADR and RevPAR were up week over week and when indexed to 2019. ...
*Due to the steep, pandemic-driven performance declines of 2020, STR is measuring recovery against comparable time periods from 2019.
emphasis added
 Click on graph for larger image.
The red line is for 2022, black is 2020, blue is the median, and dashed light blue is for 2021.
Although down compared to 2019, the 4-week average of the occupancy rate is close to the median rate for the previous 20 years (Blue).
Note: Y-axis doesn't start at zero to better show the seasonal change.
The 4-week average of the occupancy rate will increase seasonally over the next few months.


