 RSS Feed
 by Calculated Risk on 12/13/2021 10:14:00 AM
Monday, December 13, 2021
Housing Inventory December 13th Update: Inventory Down 3.3% Week-over-week
Tracking existing home inventory is very important this year and in 2022.
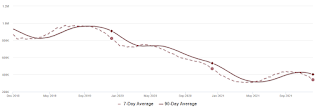
This inventory graph is courtesy of Altos Research.
As of December 10th, inventory was at 339 thousand (7-day average), compared to 469 thousand for the same week a year ago. That is a decline of 27.7%. Inventory is down 3.3% from last week.
Compared to the same week in 2019, inventory is down 58.8% from 822 thousand. A week ago, inventory was at 350 thousand, and was down 27.1% YoY.
Seasonally, inventory bottomed in April (usually inventory bottoms in January or February). Inventory last week was about 10.6% above the record low set-in early April.
Inventory peaked for the year in early September, when inventory was at 437 thousand (the peak for the year), so inventory is currently off about 22.5% from the peak for the year.
Mike Simonsen discusses this data regularly on Youtube.


