 RSS Feed
 by Calculated Risk on 3/30/2021 09:09:00 AM
Tuesday, March 30, 2021
Case-Shiller: National House Price Index increased 11.2% year-over-year in January
S&P/Case-Shiller released the monthly Home Price Indices for January ("January" is a 3 month average of November, December and January prices).
This release includes prices for 20 individual cities, two composite indices (for 10 cities and 20 cities) and the monthly National index.
From S&P: S&P Corelogic Case-Shiller Index Reports 11.2% Annual Home Price Gain to Start 2021
The S&P CoreLogic Case-Shiller U.S. National Home Price NSA Index, covering all nine U.S. census divisions, reported an 11.2% annual gain in January, up from 10.4% in the previous month. The 10-City Composite annual increase came in at 10.9%, up from 9.9% in the previous month. The 20-City Composite posted an 11.1% year-over-year gain, up from 10.2% in the previous month.
Phoenix, Seattle, and San Diego continued to report the highest year-over-year gains among the 20 cities in January. Phoenix led the way with a 15.8% year-over-year price increase, followed by Seattle with a 14.3% increase and San Diego with a 14.2% increase. All 20 cities reported higher price increases in the year ending January 2021 versus the year ending December 2020.
...
Before seasonal adjustment, the U.S. National Index posted a 0.8% month-over-month increase, while the 10-City and 20-City Composites both posted increases of 0.8% and 0.9% respectively in January. After seasonal adjustment, the U.S. National Index posted a month-over-month increase of 1.2%, and the 10-City and 20-City Composites both posted increases of 1.2% as well. In January, 19 of 20 cities reported increases before seasonal adjustment, and all 20 cities reported increases after seasonal adjustment.
“The strong price gains that we observed in the last half of 2020 continued into the first month of the new year. In January 2021, the National Composite Index rose by 11.2% compared to its year-ago levels,” says Craig J. Lazzara, Managing Director and Global Head of Index Investment Strategy at S&P DJI. “The trend of accelerating prices that began in June 2020 has now reached its eighth month and is also reflected in the 10- and 20-City Composites (up 10.9% and 11.1%, respectively). The market’s strength is broadly-based: all 20 cities rose, and all 20 cities gained more in the 12 months ended in January 2021 than they had gained in the 12 months ended in December 2020.
emphasis added
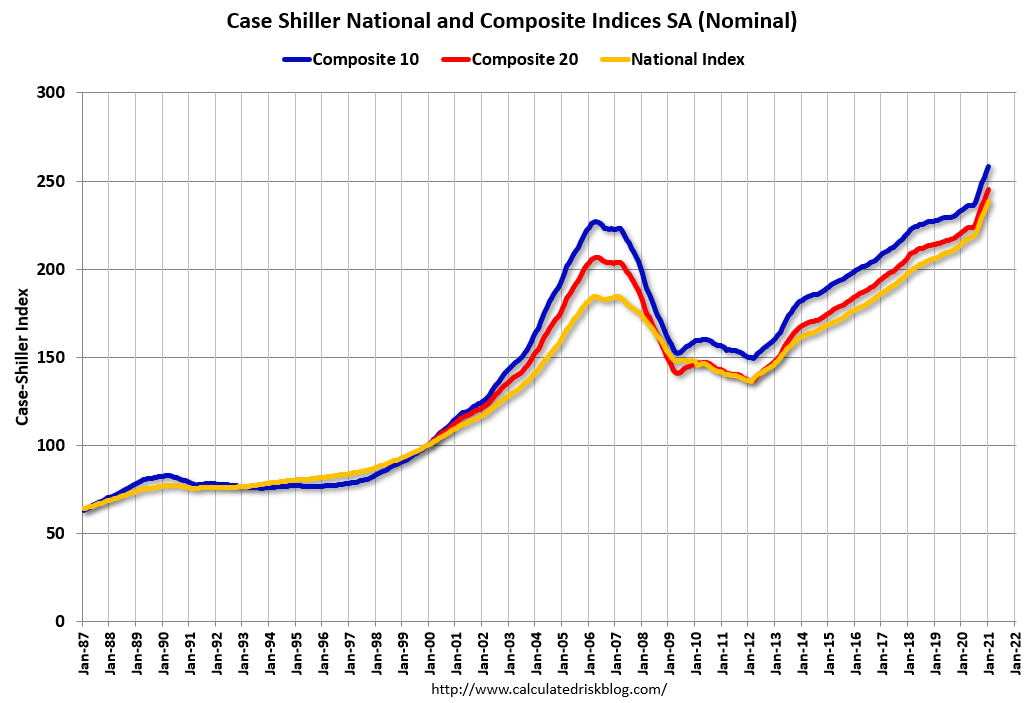 Click on graph for larger image.
 The first graph shows the nominal seasonally adjusted Composite 10, Composite 20 and National indices (the Composite 20 was started in January 2000).
The Composite 10 index is up 1.2% in January (SA) from December.
The Composite 20 index is up 1.2% (SA) in January.
The National index is 29% above the bubble peak (SA), and up 1.2% (SA) in January. The National index is up 75% from the post-bubble low set in December 2011 (SA).
 The second graph shows the year-over-year change in all three indices.
The Composite 10 SA is up 10.9% compared to January 2020. The Composite 20 SA is up 11.1% year-over-year.
The National index SA is up 11.2% year-over-year.
Note: According to the data, prices increased in 20 cities month-over-month seasonally adjusted.
Price increases were above expectations. I'll have more later.


