 RSS Feed
 by Calculated Risk on 5/26/2020 09:10:00 AM
Tuesday, May 26, 2020
Case-Shiller: National House Price Index increased 4.4% year-over-year in March
Note: This is for March and is mostly pre-crisis data.
S&P/Case-Shiller released the monthly Home Price Indices for March ("March" is a 3 month average of January, February and March prices).
This release includes prices for 20 individual cities, two composite indices (for 10 cities and 20 cities) and the monthly National index.
Note: Case-Shiller reports Not Seasonally Adjusted (NSA), I use the SA data for the graphs.
From S&P: Annual Home Price Gains Increased to 4.4% in March According to S&P CoreLogic Case-Shiller Index
The S&P CoreLogic Case-Shiller U.S. National Home Price NSA Index, covering all nine U.S. census divisions, reported a 4.4% annual gain in March, up from 4.2% in the previous month. The 10-City Composite annual increase came in at 3.4%, up from 3.0% in the previous month. The 20-City Composite posted a 3.9% year-over-year gain, up from 3.5% in the previous month.
Phoenix, Seattle and Charlotte reported the highest year-over-year gains among the 19 cities (excluding Detroit for the month). In March, Phoenix led the way with an 8.2% year-over-year price increase, followed by Seattle with a 6.9% increase and Charlotte with a 5.8% increase. Seventeen of the 19 cities reported higher price increases in the year ending March 2020 versus the year ending February 2020.
...
The National Index posted a 0.8% month-over-month increase, while the 10-City and 20-City Composites posted increases of 1.0% and 1.1% respectively before seasonal adjustment in March. After seasonal adjustment, the National Index and the 20-City Composite posted a month-over-month increase of 0.5%, while the 10-City Composite a posted 0.4% increase. In March, all 19 cities (excluding Detroit) reported increases before seasonal adjustment as well as after seasonal adjustment.
"March’s data witnessed the first impact of the COVID-19 pandemic on the S&P CoreLogic Case-Shiller Indices,” says Craig J. Lazzara, Managing Director and Global Head of Index Investment Strategy at S&P Dow Jones Indices. “We have data from only 19 cities this month, since transactions records for Wayne County, Michigan (in the Detroit metropolitan area) were unavailable.
“That said, housing prices continue to be remarkably stable. The National Composite Index rose by 4.4% in March 2020, with comparable growth in the 10- and 20-City Composites (up 3.4% and 3.9%, respectively). In all three cases, March’s year-over-year gains were ahead of February’s, continuing a trend of gently accelerating home prices that began last autumn. March results were broad-based. Prices rose in each of the 19 cities for which we have reported data, and price increases accelerated in 17 cities.
emphasis added
 Click on graph for larger image.
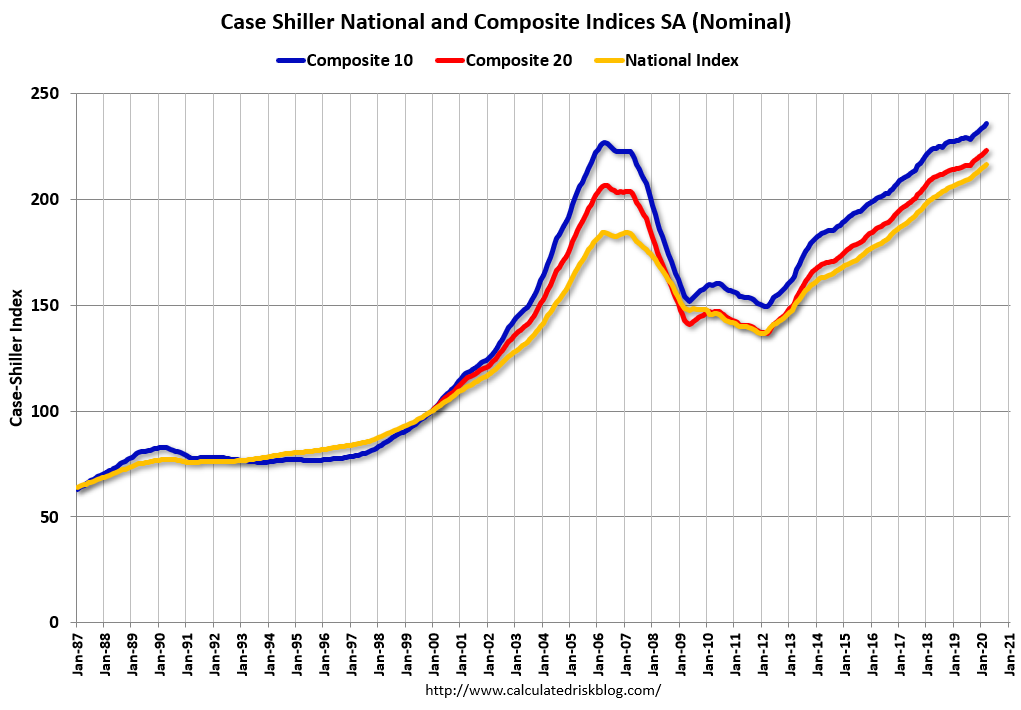
 The first graph shows the nominal seasonally adjusted Composite 10, Composite 20 and National indices (the Composite 20 was started in January 2000).
The Composite 10 index is up 3.9% from the bubble peak, and up 0.4% in March (SA) from February.
The Composite 20 index is 8.0% above the bubble peak, and up 0.5% (SA) in March.
The National index is 17% above the bubble peak (SA), and up 0.5% (SA) in March. The National index is up 59% from the post-bubble low set in December 2011 (SA).
 The second graph shows the Year over year change in all three indices.
The Composite 10 SA is up 3.3% compared to March 2019. The Composite 20 SA is up 3.9% year-over-year.
The National index SA is up 4.4% year-over-year.
Note: According to the data, prices increased in 19 of 20 cities month-over-month seasonally adjusted.
I'll have more later.


