by Calculated Risk on 2/10/2018 08:11:00 AM
Saturday, February 10, 2018
Schedule for Week of Feb 11, 2018
The key economic reports this week are January Housing Starts, Retail Sales and the Consumer Price Index (CPI).
For manufacturing, January industrial production, and the February New York, and Philly Fed manufacturing surveys, will be released this week.
No major economic releases scheduled.
6:00 AM ET: NFIB Small Business Optimism Index for January.
7:00 AM ET: The Mortgage Bankers Association (MBA) will release the results for the mortgage purchase applications index.
 8:30 AM ET: Retail sales for January will be released. The consensus is for a 0.3% increase in retail sales.
This graph shows the year-over-year change in retail sales and food service (ex-gasoline) since 1993. Retail and Food service sales, ex-gasoline, increased by 4.9% on a YoY basis in December.
8:30 AM: The Consumer Price Index for January from the BLS. The consensus is for a 0.3% increase in CPI, and a 0.2% increase in core CPI.
10:00 AM: Manufacturing and Trade: Inventories and Sales (business inventories) report for December. The consensus is for a 0.2% increase in inventories.
8:30 AM ET: The initial weekly unemployment claims report will be released. The consensus is for 229 thousand initial claims, up from 221 thousand the previous week.
8:30 AM: the Philly Fed manufacturing survey for February. The consensus is for a reading of 21.5, down from 22.2.
8:30 AM: The Producer Price Index for January from the BLS. The consensus is a 0.4% increase in PPI, and a 0.2% increase in core PPI.
8:30 AM ET: The New York Fed Empire State manufacturing survey for February. The consensus is for a reading of 17.5, down from 17.7.
 9:15 AM: The Fed will release Industrial Production and Capacity Utilization for January.
This graph shows industrial production since 1967.
The consensus is for a 0.2% increase in Industrial Production, and for Capacity Utilization to increase to 78.0%.
10:00 AM: The February NAHB homebuilder survey. The consensus is for a reading of 72, unchanged from 72 in January. Any number above 50 indicates that more builders view sales conditions as good than poor.
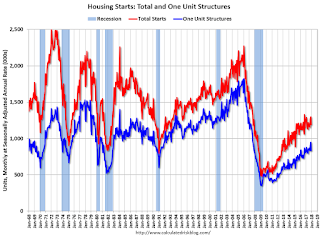
 8:30 AM: Housing Starts for January.
 This graph shows single and total housing starts since 1968.
The consensus is for 1.230 million SAAR, up from 1.192 million SAAR.
10:00 AM: University of Michigan's Consumer sentiment index (Preliminary for February). The consensus is for a reading of 95.5, down from 95.7.


