by Calculated Risk on 1/09/2017 08:11:00 AM
Monday, January 09, 2017
Black Knight November Mortgage Monitor
Black Knight Financial Services (BKFS) released their Mortgage Monitor report for November today. According to BKFS, 4.46% of mortgages were delinquent in November, down from 4.92% in November 2015. BKFS also reported that 0.98% of mortgages were in the foreclosure process, down from 1.38% a year ago.
This gives a total of 5.44% delinquent or in foreclosure.
Press Release: Black Knight’s Mortgage Monitor: 2.2 Million Homeowners in Negative Equity, Fewest Since Early 2007; $4.6 Trillion in Tappable Equity is Within Six Percent of Peak
Today, the Data & Analytics division of Black Knight Financial Services, Inc. (NYSE: BKFS) released its latest Mortgage Monitor Report, based on data as of the end of November 2016. In the first three quarters of 2016, as home prices continued to appreciate, one million previously underwater homeowners returned to positive equity positions, while tappable equity totals continued to rise. This month, Black Knight looked at the extent and impact of these changes on the market. As Black Knight Data & Analytics Executive Vice President Ben Graboske explained, there is a distinct geographical component at work, with regard to both the negative and tappable equity sides of the equation.
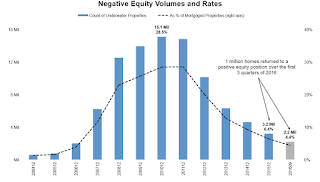
“The negative equity situation has improved substantially since the height of the great recession,” said Graboske. “There are now just 2.2 million homeowners left in negative equity positions, a full one million fewer than at the start of 2016. Whereas negative home equity was once a widespread national problem – with roughly 30 percent of all homeowners being underwater on their mortgages at the end of 2010 – it has now become much more of a localized issue. By and large, the majority of states have negative equity rates below the national average of 4.4 percent. There are, though, some pockets where homeowners continue to struggle. Three states in particular stand out: Nevada, Missouri and New Jersey, all of which have negative equity rates more than twice the national average."
emphasis added
 Click on graph for larger image.
This graph from Black Knight shows their estimate of the number and percent of loans with negative equity.
From Black Knight:
• Only 2.2 million (4.4 percent) mortgage holders remain underwater on their homes, a decline of one million since the beginning of 2016
• Whereas negative equity was once a widespread national problem – with nearly 30 percent of all homeowners being underwater on their mortgages at the end of 2010 – it has now become much more of a localized issue
• Lower priced homes – those in the bottom 20 percent of prices in their communities – are nine times more likely to be underwater than those in the top 20 percent
• The negative equity rate for borrowers living in the bottom 20 percent of their metro area by price is 11.5 percent, compared to just 1.3 percent for those in the top 20 percent of the market
 This graph from Black Knight shows their estimate of tappable equity:
From Black Knight:
• There are now 39 million borrowers with tappable equity in their homes, meaning they have current combined loan-to-value (CLTV) ratios of less than 80 percentThere is much more in the mortgage monitor.
• These borrowers have a total of $4.6 trillion in available, lendable equity—an average of about $180,000 per borrower—making for the highest market total and highest average per borrower since 2006
• Total tappable equity grew by $500 billion in just the first three quarters of 2016
• We are now within about six percent of the peak in lendable/tappable equity seen back in late 2005/early 2006


