by Calculated Risk on 4/06/2015 04:08:00 PM
Monday, April 06, 2015
Update: U.S. Heavy Truck Sales
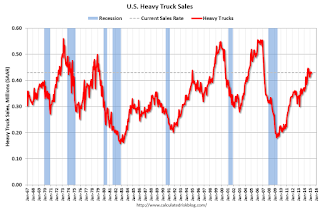
Click on graph for larger image.
This graph shows heavy truck sales since 1967 using data from the BEA. The dashed line is the March 2015 seasonally adjusted annual sales rate (SAAR).
Heavy truck sales really collapsed during the recession, falling to a low of 181 thousand in April 2009 on a seasonally adjusted annual rate basis (SAAR). Since then sales have more than doubled and hit 446 thousand SAAR in August 2014. Sales have declined a little since August (possibly due to the oil sector), and were at 430 thousand SAAR in March.
The level in August 2014 was the highest level since February 2007 (over 7 years ago). Sales have been above 400 thousand SAAR for nine consecutive months, are now above the average (and median) of the last 20 years.


