 RSS Feed
 by Calculated Risk on 12/04/2013 10:00:00 AM
Wednesday, December 04, 2013
New Home Sales increased to 444,000 Annual Rate in October
Note: The New Home sales reports for September and October were both released today (delayed due to government shutdown).
The Census Bureau reports New Home Sales in October were at a seasonally adjusted annual rate (SAAR) of 444 thousand, and sales in September were at a 354 thousand SAAR.
August sales were revised down from 421 thousand to 379 thousand, and July sales were revised down from 390 thousand to 373 thousand.
The first graph shows New Home Sales vs. recessions since 1963. The dashed line is the current sales rate.
"Sales of new single-family houses in October 2013 were at a seasonally adjusted annual rate of 444,000, according to estimates released jointly today by the U.S. Census Bureau and the Department of Housing and Urban Development. This is 25.4 percent above the revised September rate of 354,000 and is 21.6 percent above the October 2012 estimate of 365,000."
 Click on graph for larger image in graph gallery.
The second graph shows New Home Months of Supply.
The months of supply decreased in October to 4.9 months from 6.4 months in September.
The all time record was 12.1 months of supply in January 2009.
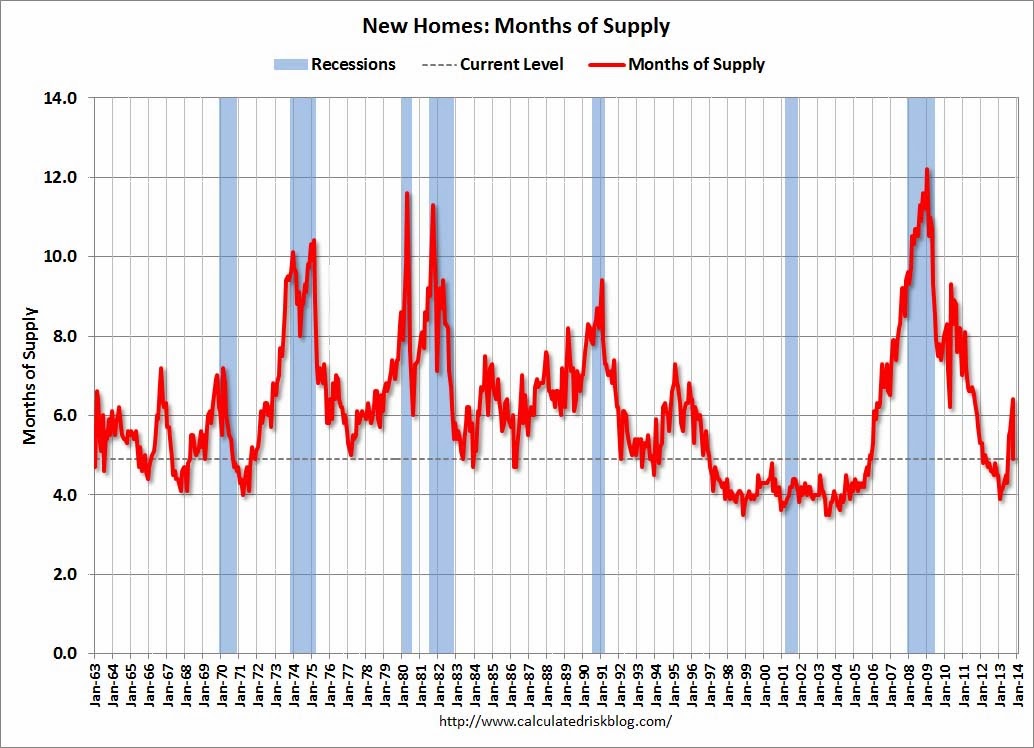 This is now in the normal range (less than 6 months supply is normal).
"The seasonally adjusted estimate of new houses for sale at the end of October was 183,000. This represents a supply of 4.9 months at the current sales rate."On inventory, according to the Census Bureau:
"A house is considered for sale when a permit to build has been issued in permit-issuing places or work has begun on the footings or foundation in nonpermit areas and a sales contract has not been signed nor a deposit accepted."Starting in 1973 the Census Bureau broke this down into three categories: Not Started, Under Construction, and Completed.
 This graph shows the three categories of inventory starting in 1973.
The inventory of completed homes for sale is near the record low. The combined total of completed and under construction is increasing, but still very low.
The last graph shows sales NSA (monthly sales, not seasonally adjusted annual rate).
In October 2013 (red column), 35 thousand new homes were sold (NSA). Last year 29 thousand homes were sold in October. The high for October was 105 thousand in 2005, and the low for October was 23 thousand in 2010.

This was above expectations of 425,000 sales in October, but there were significant downward revisions to prior months (as expected based on builder reports).
I'll have more later today - but no worries - the housing recovery will continue!


