by Calculated Risk on 4/05/2013 04:30:00 PM
Friday, April 05, 2013
AAR: Rail Traffic "mixed" in March
From the Association of American Railroads (AAR): AAR Reports Mixed Rail Traffic for March, Declines for Week Ending March 30
Intermodal traffic in March 2013 totaled 933,208 containers and trailers, up 0.5 percent (4,859 units) compared with March 2012. That percentage increase represents the smallest year-over-year monthly gain for intermodal since August 2011.
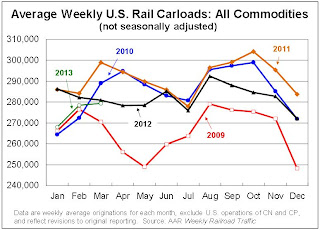
Carloads originated in March 2013 totaled 1,117,427, down 0.5 percent (5,969 carloads) compared with the same month last year. While it was a decline, March had the lowest year-over-year monthly dip in carloads since January of 2012. Carloads excluding coal and grain were up 3.4 percent (19,965 carloads) in March 2013 over March 2012.
“U.S. rail traffic continues to mirror the overall economy: not great, not terrible, anticipating a better future,” said AAR Senior Vice President John T. Gray. “Petroleum and petroleum products continues to lead traffic gains, while coal and grain have seen better days. Intermodal volume in March was up just 0.5 percent over last year, but it was still the highest-volume March in history and built on even stronger gains earlier in the quarter.”
emphasis added
 Click on graph for larger image.
This graph from the Rail Time Indicators report shows U.S. average weekly rail carloads (NSA). Green is 2013.
Commodities with the biggest carload increases in March included petroleum and petroleum products, up 54.3 percent or 19,295 carloads; crushed stone, gravel and sand, up 11.9 percent or 8,380 carloads; motor vehicles and parts, up 6.1 percent or 4,127 carloads; and coke, up 11.4 percent or 1,550 carloads. Commodities with carload declines last month included grain, down 20.1 percent or 16,971 carloads; coal, down 2 percent or 8,963 carloads; metallic ores, down 13.2 percent or 2,908 carloads; and chemicals, down 1.3 percent or 1,581 carloads.Note that building related commodities were up.
The second graph is for intermodal traffic (using intermodal or shipping containers):
 Graphs and excerpts reprinted with permission.
Intermodal traffic was weaker in March, but still on track for a record year in 2013:
After a stellar February, U.S. intermodal traffic came back to earth in March. U.S. railroads originated 933,208 containers and trailers in March 2013, up just 0.5% (4,859 units) over March 2012. (The comparable numbers were 10.5% and 93,231 units in February.) That’s the smallest year-over-year monthly increase since August 2011. On the other hand, March 2013’s weekly average of 233,302 containers and trailers is the highest average for any March in history.Earlier on the employment report:
• March Employment Report: 88,000 Jobs, 7.6% Unemployment Rate
• Employment Report Comments and more Graphs
• All Employment Graphs


