by Calculated Risk on 11/24/2012 08:03:00 AM
Saturday, November 24, 2012
Summary for Week Ending Nov 23rd
Last week was a short holiday week and I hope everyone is enjoying their Thanksgiving weekend!
Overall the economic data was positive last week, especially the housing data. Housing starts were at the highest level in four years, but are still very low - and both comments are important. Housing (residential investment) is now a tail wind for the economy, and housing can increase significantly from here.
Also the existing home sales market continues to show improvement. The keys for the existing home report are inventory and the number of conventional sales. Inventory is down significantly, and conventional sales are increasing. There will be more housing data next week (New home sales and the Case-Shiller house price indexes).
Initial weekly unemployment claims were still elevated because of Hurricane Sandy, but I expect claims will decline back to the pre-storm level pretty quickly.
Early in the week I spoke with Joe Weisenthal at Business Insider, and he wrote a way too nice article: The Genius Who Invented Economics Blogging Reveals How He Got Everything Right And What's Coming Next.
As I noted, I just track economic data and make a few forecasts - and I didn't invent economic blogging (although I've been at it for eight years). Professor Krugman added a few nice comments: All Hail Calculated Risk.
Excuse my blushing - thanks to all for reading!
Here is a summary of last week in graphs:
• Housing Starts increased to 894 thousand SAAR in October
 Click on graph for larger image.
Total housing starts were at 894 thousand (SAAR) in October, up 3.6% from the revised September rate of 863 thousand (SAAR). Note that September was revised down from 872 thousand.
Single-family starts decreased slightly to 594 thousand in October.
Total starts are up about 87% from the bottom start rate, and single family starts are up about 70% from the low.
This was above expectations of 840 thousand starts in October. This was mostly because of the volatile multi-family sector that increased sharply in October, however single family starts have increased recently too. Starts are still very low, but on pace to be up about 25% from 2011.
• Existing Home Sales in October: 4.79 million SAAR, 5.4 months of supply
 This graph shows existing home sales, on a Seasonally Adjusted Annual Rate (SAAR) basis since 1993.
 Sales in October 2012 (4.79 million SAAR) were 2.1% higher than last month, and were 10.9% above the October 2011 rate.
The second graph shows the year-over-year (YoY) change in reported existing home inventory and months-of-supply. Since inventory is not seasonally adjusted, it really helps to look at the YoY change. Note: Months-of-supply is based on the seasonally adjusted sales and not seasonally adjusted inventory.
 Inventory decreased 21.9% year-over-year in October from October 2011. This is the 20th consecutive month with a YoY decrease in inventory.
Months of supply declined to 5.4 months in October.
This was slightly above expectations of sales of 4.74 million. For existing home sales, the key number is inventory - and the sharp year-over-year decline in inventory is a positive for housing.
• Weekly Initial Unemployment Claims decline to 410,000

The dashed line on the graph is the current 4-week average. The four-week average of weekly unemployment claims increased to 396,250.
This sharp increase in the 4 week average is due to Hurricane Sandy as claims increased significantly in the impacted areas. Note the spike in 2005 related to hurricane Katrina - we are seeing a similar impact, although on a smaller scale.
Weekly claims were about at the consensus forecast.
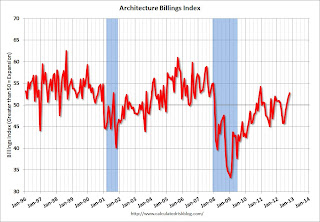
• AIA: Architecture Billings Index increases in October, Highest in Two Years
Note: This index is a leading indicator primarily for new Commercial Real Estate (CRE) investment.
 This graph shows the Architecture Billings Index since 1996. The index was at 52.8 in October, up from 51.6 in September. Anything above 50 indicates expansion in demand for architects' services.
This increase is mostly being driven by demand for design of multi-family residential buildings - and this suggests there are more apartments coming (there are already quite a few apartments under construction). New project inquiries are also increasing. Note: This includes commercial and industrial facilities like hotels and office buildings, multi-family residential, as well as schools, hospitals and other institutions.
According to the AIA, there is an "approximate nine to twelve month lag time between architecture billings and construction spending" on non-residential construction. This suggests some increase in CRE investment next year (it will be some time before investment in offices and malls increases significantly).
• Final November Consumer Sentiment at 82.7
 The final Reuters / University of Michigan consumer sentiment index for November declined to 82.7 from the preliminary reading of 84.9, and was up from the October reading of 82.6.
This was below the consensus forecast of 84.0. Overall, consumer sentiment has been improving; the recent decline in sentiment might be related to the stock market decline (the consumer sentiment index is impacted by employment, gasoline prices, the stock market and more).


