by Calculated Risk on 9/22/2012 01:05:00 PM
Saturday, September 22, 2012
Summary for Week Ending Sept 21st
Once again, the housing news was mostly positive last week and manufacturing was mostly disappointing.
Housing starts were a little below expectations - mostly because of the volatile multi-family sector - but starts are still up sharply from a year ago. Two-thirds of the way through 2012, single family starts are on pace for 515 thousand this year, and total starts are on pace for about 740 thousand.
In 2011, there were 609 total starts, and a record low 430 thousand single family starts. So housing starts are on pace for about a 20% increase from 2011. No wonder builder confidence was at the highest level since June 2006. That is a significant increase and will give the economy a boost.
Existing home sales increased too. The key numbers in the existing home sales report are inventory and months-of-supply. Inventory was down 18.2% year-over-year in August, and months-of-supply declined to 6.1 months - the lowest for the month of August since 2005.
The decline in inventory has been stunning, even for those of us expecting a significant decline - and I expect the year-over-year declines will start to decrease in the coming months.
Unfortunately both regional manufacturing surveys released this week (Empire State and Philly Fed) both showed contraction in September (although the Philly Fed index was close to unchanged).
A final note: The Fed's Flow of Funds survey showed household mortgage debt has decreased by over $1 trillion from the peak. Some of this decline is from homeowners paying down their mortgage (perhaps to refinance), but most of the decline was due to foreclosures or short sales (defaults). This reminded me of some of my posts from years ago ... new readers might not realize I was once one of the biggest bears around, see: The Trillion Dollar Bear
Here is a summary of last week in graphs:
• Housing Starts increased to 750 thousand in August
 Click on graph for larger image.
Total housing starts were at 750 thousand (SAAR) in August, up 2.3% from the revised July rate of 733 thousand (SAAR). Note that July was revised from 746 thousand.
Single-family starts increased 5.5% to 535 thousand in August.
Total starts are up 57% from the bottom start rate, and single family starts are up 51% from the low.
This was below expectations of 768 thousand starts in August, but the key is starts are up solidly from last year. Right now starts are on pace to be up about 25% from 2011. Also total permits are up sharply from last year.
• Existing Home Sales in August: 4.82 million SAAR, 6.1 months of supply
 The NAR reports: August Existing-Home Sales and Prices Rise
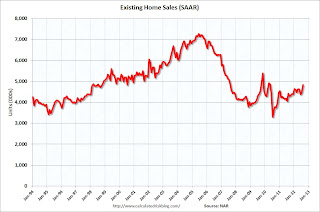
This graph shows existing home sales, on a Seasonally Adjusted Annual Rate (SAAR) basis since 1993.
Sales in August 2012 (4.82 million SAAR) were 7.8% higher than last month, and were 9.3% above the August 2011 rate.
 This graph shows the year-over-year (YoY) change in reported existing home inventory and months-of-supply. Since inventory is not seasonally adjusted, it really helps to look at the YoY change. Note: Months-of-supply is based on the seasonally adjusted sales and not seasonally adjusted inventory.
Inventory decreased 18.2% year-over-year in August from August 2011. This is the eighteenth consecutive month with a YoY decrease in inventory.
Months of supply declined to 6.1 months in August.
This was above expectations of sales of 4.55 million. For existing home sales, the key number is inventory - and the sharp year-over-year decline in inventory is a positive for housing.
• AIA: Architecture Billings Index shows slight expansion in August
 From AIA: Architecture Billings Index Inches Back into Positive Territory
This graph shows the Architecture Billings Index since 1996. The index was at 50.2 in August, up from 48.7 in July. Anything above 50 indicates expansion in demand for architects' services.
Note: This includes commercial and industrial facilities like hotels and office buildings, multi-family residential, as well as schools, hospitals and other institutions.
According to the AIA, there is an "approximate nine to twelve month lag time between architecture billings and construction spending" on non-residential construction. This suggests further weakness in CRE investment later this year and into next year (it will be some time before investment in offices and malls increases).
• Weekly Initial Unemployment Claims at 382,000
 The DOL reports: "In the week ending September 15, the advance figure for seasonally adjusted initial claims was 382,000, a decrease of 3,000 from the previous week's revised figure of 385,000." The dashed line on the graph is the current 4-week average. The four-week average of weekly unemployment claims increased to 377,750.
This was above the consensus forecast of 373,000.
• Empire State and Philly Fed Manufacturing Surveys show contraction in September
 From the Philly Fed: September Manufacturing Survey "The survey’s broadest measure of manufacturing conditions, the diffusion index of current activity, increased 5 points, to a reading of -1.9."
From MarketWatch: Empire State index hits nearly two-year low
This graph compares the regional Fed surveys and the ISM manufacturing index. The dashed green line is an average of the NY Fed (Empire State) and Philly Fed surveys through September. The ISM and total Fed surveys are through August.
The average of the Empire State and Philly Fed surveys increased slightly in September, and has remained negative for four consecutive months. This suggests another weak reading for the ISM manufacturing index.
• Fed's Q2 Flow of Funds: Household Mortgage Debt down $1 Trillion from Peak
The Federal Reserve released the Q2 2012 Flow of Funds report this week: Flow of Funds.
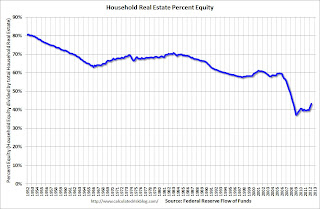
 This graph shows homeowner percent equity since 1952.
 Household percent equity (as measured by the Fed) collapsed when house prices fell sharply in 2007 and 2008.
In Q2 2012, household percent equity (of household real estate) was at 43.1% - up from Q1, and the highest since Q2 2008. This was because of a small increase in house prices in Q2 (the Fed uses CoreLogic) and a reduction in mortgage debt.
Note: about 30.3% of owner occupied households had no mortgage debt as of April 2010. So the approximately 52+ million households with mortgages have far less than 43.1% equity - and over 10 million have negative equity.
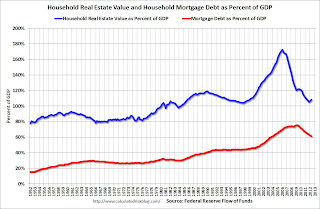
 The third graph shows household real estate assets and mortgage debt as a percent of GDP.
 Mortgage debt declined by $51 billion in Q2. Mortgage debt has now declined by $1.05 trillion from the peak. Studies suggest most of the decline in debt has been because of foreclosures (or short sales), but some of the decline is from homeowners paying down debt (sometimes so they can refinance at better rates).
The value of real estate, as a percent of GDP, was up slightly in Q2 (as house prices increased), but is still near the lows of the last 30 years. However household mortgage debt, as a percent of GDP, is still historically very high, suggesting more deleveraging (defaulting) ahead for households.
• Other Economic Stories ...
• LA area Port Traffic: Imports and Exports down YoY in August
• NAHB Builder Confidence increases in September, Highest since June 2006
• The Trillion Dollar Bear


