by Calculated Risk on 5/31/2012 04:15:00 PM
Thursday, May 31, 2012
LPS: Foreclosures Sales declined in April, FHA foreclosure starts increased sharply
Note: U.S. District Court Judge Collyer approved the consent order for the mortgage servicer settlement on April 5th, and so far there hasn't been a significant impact from the agreement on delinquencies or foreclosure sales.
LPS released their Mortgage Monitor report for April today. According to LPS, 7.12% of mortgages were delinquent in April, up slightly from 7.09% in March, and down from 7.97% in April 2011.
LPS reports that 4.14% of mortgages were in the foreclosure process, unchanged from March, and also unchanged from April 2011.
This gives a total of 11.26% delinquent or in foreclosure. It breaks down as:
• 1,927,000 loans less than 90 days delinquent.
• 1,595,000 loans 90+ days delinquent.
• 2,048,000 loans in foreclosure process.
For a total of 5,570,000 loans delinquent or in foreclosure in April. This is down from 6,388,000 in April 2011.
This following graph shows the total delinquent and in-foreclosure rates since 1995.
 Click on graph for larger image.
The total delinquency rate has fallen to 7.12% from the peak in January 2010 of 10.97%. A normal rate is probably in the 4% to 5% range, so there is a long ways to go.
The in-foreclosure rate was at 4.14%, down from the record high in October 2011 of 4.29%. There are still a large number of loans in this category (about 2.05 million).
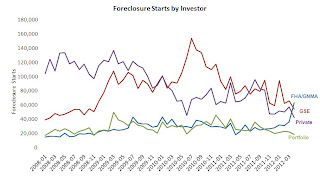
 The second graph shows foreclosure starts by investor.
From LPS: "[O]verall foreclosure starts were down 2.6 percent in April, FHA foreclosure starts spiked significantly, jumping 73 percent during the month. The rise was driven primarily by defaults in 2008 and 2009 vintage loans, though all FHA vintages saw increases in foreclosure starts in April, despite that fact that the more recent vintages – from 2009 forward – have shown improved relative credit performance."
The third graph shows the FHA performance by vintage.
 This graph shows the 90%+ delinquency rate by month since origination (number of payments).
The worst performing loans were in 2006, 2007 and 2008. The best performing loans were made in recent years.
However, as the last graph shows, the FHA made a huge number of loans in 2008, 2009 and 2010. According to the Case-Shiller national index, prices have fallen about about 18% since mid-2008, putting most of those FHA borrowers "underwater" on their mortgages. The price declines since mid-2009 and mid-2010 are much less.
 From LPS: “In 2008, when the loan origination market virtually dried up, the FHA stepped in to fill the void,” explained Herb Blecher, senior vice president for LPS Applied Analytics. “FHA
originations tripled that year, and increased to five times historical averages in 2009. High volumes like that, even with low default rates, can produce larger numbers of foreclosure starts.
That represents a lot of loans to work through – the 2008 vintage alone represents some $14 billion of unpaid balances in foreclosure, and the overall FHA foreclosure inventory continues torise.”
There is much more in the Mortgage Monitor report.


