by Calculated Risk on 2/11/2012 08:05:00 AM
Saturday, February 11, 2012
Summary for Week ending February 10th
This was a light week for economic data; however there were two significant economic developments: 1) the long awaited mortgage servicer settlement agreement was announced, and 2) there was some progress with the Greek debt discussions – although there is more drama ahead.
A key economic question is the impact of the settlement on delinquencies and foreclosure activity, and by extension, on housing and the economy. This settlement should lead to both more modifications and more foreclosures, and for a decline in the number of seriously delinquent mortgages. It isn't clear how many more REOs will be on the market this year, but I don't expect a flood of REOs as happened in late 2008 and early 2009.
The data was mixed last week. The trade deficit was higher than expected, consumer confidence fell a little more than expected, but initial weekly unemployment claims fell again – and the four week average declined to the lowest level since May 2008.
Next week will be busy!
Here is a summary in graphs:
• Trade Deficit increased in December to $48.8 Billion
The trade deficit was slightly above the consensus forecast of $48.5 billion.
 Click on graph for larger image.
The first graph shows the monthly U.S. exports and imports in dollars through November 2011. Both exports and imports increased in December. Imports stalled in the middle of 2011, but increased towards the end of the year (seasonally adjusted). Exports are well above the pre-recession peak and up 9% compared to December 2010; imports are up about 11% compared to December 2010.
The second graph shows the U.S. trade deficit, with and without petroleum, through December.
 The blue line is the total deficit, and the black line is the petroleum deficit, and the red line is the trade deficit ex-petroleum products.
Oil averaged $104.13 per barrel in December. The trade deficit with China declined to $23 billion, but hit an annual record in 2011.
Exports to eurozone countries increased slightly in December after declining sharply in November.
• Weekly Initial Unemployment Claims decline to 358,000
 Here is a long term graph of weekly claims:
The dashed line on the graph is the current 4-week average. The four-week average of weekly unemployment claims decreased this week to 366,250.
The 4-week moving average is at the lowest level since May 2008.
• BLS: Job Openings increased in December
 From the BLS: Job Openings and Labor Turnover Summary
 There were 3.4 million job openings on the last business day of December, up from 3.1 million in November, the U.S. Bureau of Labor Statistics reported today.This graph shows job openings (yellow line), hires (dark blue), Layoff, Discharges and other (red column), and Quits (light blue column) from the JOLTS.
...
Although the number of job openings remained below the 4.4 million openings when the recession began in December 2007, the number of job openings has increased 39 percent since the end of the recession in June 2009.
Jobs openings increased in December, and the number of job openings (yellow) has generally been trending up, and are up about 15% year-over-year compared to December 2010.
Quits declined slightly in December, but have mostly been trending up - quits are now up about 5% year-over-year. These are voluntary separations and more quits might indicate some improvement in the labor market. (see light blue columns at bottom of graph for trend for "quits").
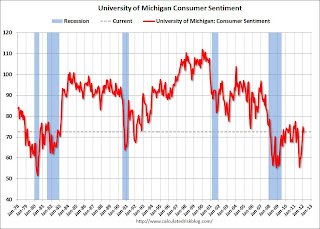
• Consumer Sentiment declines in February to 72.5
 The preliminary Reuters / University of Michigan consumer sentiment index for February declined to 72.5, down from the January reading of 75.0.
Overall sentiment is still fairly weak, although sentiment has rebounded from the decline last summer. This was below the consensus forecast of a decline to 74.3.
• Other Economic Stories ...
• Hotels: RevPAR increases 8.7% compared to same week in 2011
• MBA: Refinance activity increases as mortgage rates fall to record low
• Goldman: No Labor Force Participation Rebound in Sight
• Housing: The Two Bottoms


