by Calculated Risk on 1/31/2012 02:28:00 PM
Tuesday, January 31, 2012
Restaurant Performance Index highest in almost six years in December
From the National Restaurant Association: Restaurant Performance Index Rose to Highest Level in Nearly Six Years in December
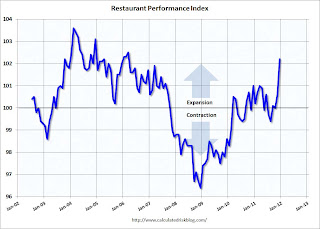
The RPI – a monthly composite index that tracks the health of and outlook for the U.S. restaurant industry – stood at 102.2 in December, up 1.6 percent from November and its highest level in nearly six years. In addition, December represented the third time in the last four months that the RPI stood above 100, which signifies expansion in the index of key industry indicators.Blame in on the lack of snow!
“Aided by favorable weather conditions in many parts of the country, a solid majority of restaurant operators reported higher same-store sales and customer traffic levels in December,” said Hudson Riehle, senior vice president of the Research and Knowledge Group for the Association. “In addition, restaurant operators are solidly optimistic about sales growth in the months ahead, and their outlook for the economy is at its strongest point in nearly a year.”
...
Building on a solid November performance that saw the strongest same-store sales results in more than four years, restaurant operators reported even better numbers in December. ... Restaurant operators also reported solid customer traffic results in December. ... In addition to positive sales and traffic levels, capital spending activity among restaurant operators continues to trend upward. Forty-eight percent of operators said they made a capital expenditure for equipment, expansion or remodeling during the last three months, the highest level in six months.
 Click on graph for larger image.
The index increased to 102.2 in December (above 100 indicates expansion).
The data for this index only goes back to 2002.
This is "D-list" data (at best), but restaurant spending is discretionary and can tell us a little something about the overall economy. This index showed contraction in July and August, but is now solidly positive.
Earlier on House Prices:
• Case Shiller: House Prices fall to new post-bubble lows in November (seasonally adjusted)
• Real House Prices and House Price-to-Rent
• All current house price graphs


