by Calculated Risk on 11/28/2011 11:56:00 AM
Monday, November 28, 2011
NY Fed Q3 Report on Household Debt and Credit
From the NY Fed: Consumer Debt Falls in Third Quarter
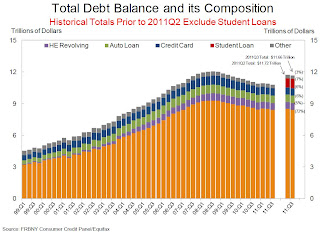
Aggregate consumer debt fell approximately $60 billion to $11.66 trillion in the third quarter of 2011 according to the Federal Reserve Bank of New York’s latest Quarterly Report on Household Debt and Credit.Here is the Q3 report: Quarterly Report on Household Debt and Credit. Here are two graphs:
...
"The decline in outstanding consumer debt reveals that households continue to try and deleverage in the wake of a challenging economic environment and large declines in home values," said Andrew Haughwout, vice president in the Research and Statistics Group at the New York Fed. "However, our findings also provide evidence that consumer credit demand continues to increase, a positive sign for consumer sentiment."
 Click on graph for larger image.
The first graph shows aggregate consumer debt decreased slightly in Q3. From the NY Fed:
Aggregate consumer debt fell slightly in the third quarter. As of September 30, 2011, total consumer indebtedness was $11.66 trillion, a reduction of $60 billion (0.6%) below its (revised) June 30, 2011 level. The 2011Q2 and 2011Q3 totals reflect improvements in our measurement of student loan balances, which we had previously undercounted ... As a result, student loan and total debt balances for 2011Q2 and 2011Q3 are not directly comparable to earlier data ...
Mortgage balances shown on consumer credit reports fell noticeably ($114 billion or 1.3%) during the quarter; home equity lines of credit (HELOC) balances rose by $14 billion (2.3%). Household mortgage and HELOC indebtedness are now 9.6% and 10.5%, respectively, below their peaks. Consumer indebtedness excluding mortgage and HELOC balances rose slightly ($32 billion or about 1.3%) in the quarter. Consumers’ non-real estate indebtedness now stands at $2.62 trillion.
 The second graph shows the percent of debt in delinquency. In general, the percent of delinquent debt is declining (there was a small increase in Q3), but what really stands out is the percent of debt 90+ days delinquent (Yellow, orange and red).
 From the NY Fed:
Total household delinquency rates rose in 2011Q3. As of September 30, 10.0% of outstanding debt was in some stage of delinquency, compared to 9.8% on June 30. About $1.2 trillion of consumer debt is currently delinquent, with $834 billion seriously delinquent (at least 90 days late or “severely derogatory”).There are a number of credit graphs at the NY Fed site.
About 264,000 individuals had a foreclosure notation added to their credit reports between June 30 and September 30, a 7% decrease from the 2011Q2 level of new foreclosures. New bankruptcies in 2011Q3 were 18.8% below their levels of 2010Q3, at 423,000.
Earlier:
• New Home Sales in October: 307,000 SAAR


