by Calculated Risk on 10/20/2011 11:45:00 AM
Thursday, October 20, 2011
Philly Fed Survey shows Expansion, Existing Home Sales NSA Graph
The high frequency data and surveys continue to indicate some improvement. Earlier this morning, the 4-week average of initial weekly unemployment claims fell to the lowest level since April - although still elevated - and now the Philly Fed manufacturing survey indicated expansion for the first time in three months - although still weak.
Even if there has been a little rebound from the economic shock in early August, due to the threat of a U.S. default, the rebound is just to sluggish growth. And there are significant downside risks from the European crisis and premature tightening in the U.S.
As a reminder, my most used post title over the last few years has been "Jobs, jobs, jobs", and even if we see sluggish growth, jobs remain priority #1 in the U.S.
• From the Philly Fed: October 2011 Business Outlook Survey
The survey’s broadest measure of manufacturing conditions, the diffusion index of current activity, increased from ‐17.5 in September to 8.7, the first positive reading in three months. The current new orders index paralleled the rise in the general activity index, increasing 19 points and returning to positive territory. The shipments index also recorded a positive reading, increasing from ‐22.8 in September to 13.6 this month.This indicates expansion in October, and was well above the consensus forecast of -9.0.
...
The current employment index remained slightly positive but decreased 4 points from its reading in September. The average workweek index increased notably from ‐13.7 to 3.1.
 Click on graph for larger image in graph gallery.
Here is a graph comparing the regional Fed surveys and the ISM manufacturing index. The dashed green line is an average of the NY Fed (Empire State) and Philly Fed surveys through October. The ISM and total Fed surveys are through September.
The average of the Empire State and Philly Fed surveys rebounded in October, and is now slightly positive.
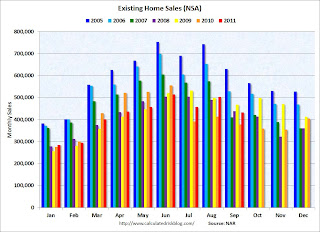
• The following graph shows existing home sales Not Seasonally Adjusted (NSA).
 The red columns are for 2011.
 Sales NSA are above last September - of course sales declined sharply last year following the expiration of the tax credit in June 2010.
The level of sales is still elevated due to investor buying. The NAR noted:
All-cash sales accounted for 30 percent of purchase activity in September, up from 29 percent in August and 29 percent also in September 2010; investors make up the bulk of cash purchases.Earlier:
• Existing Home Sales in September: 4.91 million SAAR, 8.5 months of supply
• Existing Home Sales graphs


