by Calculated Risk on 9/21/2011 04:55:00 PM
Wednesday, September 21, 2011
Will there be another Refinance Boom?
First, one of the changes in the FOMC statement was the assessment of "downside risks". The August phrase "downside risks to the economic outlook have increased" was changed to "there are significant downside risks to the economic outlook, including strains in global financial markets." (emphasis added). Now the risks are "significant".
The Ten year Treasury yield declined following the FOMC announcement today to 1.875% - another record low. The Fed will not extend maturities, but the Fed will also "reinvest principal payments from its holdings of agency debt and agency mortgage-backed securities in agency mortgage-backed securities", and that will probably push mortgage rates down.
A 3 handle for a conforming 30 year fixed rate mortgage is very possible. As of Sept 15, the 30 year fixed rate was at 4.09% for conforming loans according to the Freddie Mac Weekly Primary Mortgage Market Survey®.
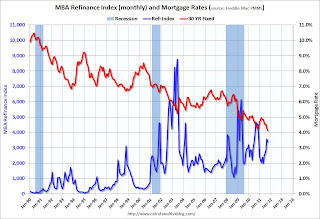
Here are a couple of graphs - the first comparing 30 year conforming mortgage rates to the MBA Refinance index (on a monthly basis), and the 2nd graph is weekly comparing the Refinance index to the Ten Year yield.
 Click on graph for larger image in graph gallery.
This graph shows the MBA's refinance index (monthly average) and the the 30 year fixed rate mortgage interest rate from the Freddie Mac Primary Mortgage Market Survey®.
The Freddie Mac survey started in 1971. Mortgage rates are currently at a record low for the last 40 years and will probably fall further.
It usually takes around a 50 bps decline from the previous mortgage rate low to get a huge refinance boom - and rates might not fall that far - but there should be an increase in refinance activity over the next few weeks. Note: 30 year conforming mortgage rates were at 4.23% in October 2010.
 The second graph compares refinance activity to the ten year yield.
The ten year yield is below the level during the financial crisis.
My guess is we see 30 year mortgage rates under 4% and a significant pickup in mortgage refinance activity - although probably not the level of refinance activity that happened in 2003 or 2009.
Earlier:
• Existing Home Sales in August: 5.0 million SAAR, 8.5 months of supply
• Existing Home Sales: Comments and NSA Graph
• Existing Home Sales graphs


