 RSS Feed
 by Calculated Risk on 9/16/2010 04:35:00 PM
Thursday, September 16, 2010
Update: Regional Fed Surveys and ISM
Note: Usually I don't watch this very closely, but right now I'm looking for signs of a slowdown in manufacturing. Eventually a watched pot does boil ...
By request - now that the Empire State and Philly Fed manufacturing surveys for September have been released - here is an update to the graph I posted last month: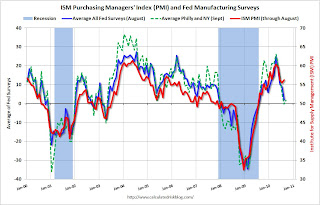 Click on graph for larger image in new window.
For this graph I averaged the New York and Philly Fed surveys (dashed green, through September), and averaged five surveys including New York, Philly, Richmond, Dallas and Kansas City (blue, through August).
The Institute for Supply Management (ISM) PMI (red) is through August (right axis).
Last month, when the ISM survey came in slightly better than expected, I wrote: "Based on this graph, I'd expect either the Fed surveys to bounce back in September - or the ISM to decline."
So far there has been little "bounce back" in the Fed surveys.


