 RSS Feed
 by Calculated Risk on 9/16/2010 01:57:00 PM
Thursday, September 16, 2010
Hotel Occupancy Rate: "Bumpy Week"
Hotel occupancy is one of several industry specific indicators I follow ...
From HotelNewsNow.com: STR: US hotel industry has bumpy week
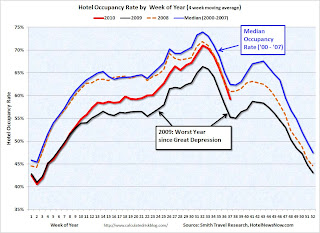
The U.S. hotel industry reported a decrease in average daily rate ADR for the first time in 13 consecutive weeks for the week of 5-11 September 2010, according to data from STR.The following graph shows the four week moving average for the occupancy rate by week for 2008, 2009 and 2010 (and a median for 2000 through 2007).
ADR fell 2.0% to US$92.84, occupancy increased 2.7% to 54.2%, and revenue per available room ended the week virtually flat with a 0.7% increase to US$50.32.
 Click on graph for larger image in new window.
Notes: the scale doesn't start at zero to better show the change. The graph shows the 4-week average, not the weekly occupancy rate.
On a 4-week basis, occupancy is up 7.2% compared to last year (the worst year since the Great Depression) and 5.1% below the median for 2000 through 2007.
The occupancy rate has fallen below the levels of 2008 again - and 2008 was a tough year for the hotel industry!
Important: Even with the occupancy rate close to 2008 levels, 2010 is a much more difficult year. The average daily rate (ADR) is off 14% from 2008 levels - so even with the similar occupancy rates, hotel room revenue is off sharply.
Data Source: Smith Travel Research, Courtesy of HotelNewsNow.com


