 RSS Feed
 by Calculated Risk on 7/13/2010 08:56:00 AM
Tuesday, July 13, 2010
Trade Deficit increases in May
The Census Bureau reports:
[T]otal May exports of $152.3 billion and imports of $194.5 billion resulted in a goods and services deficit of $42.3 billion, up from $40.3 billion in April, revised. May exports were $3.5 billion more than April exports of $148.7 billion. [May] imports were $5.5 billion more than April imports of $189.0 billion.
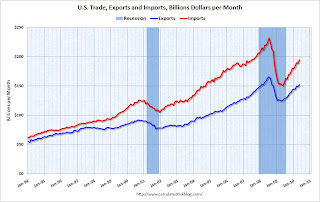 Click on graph for larger image.
The first graph shows the monthly U.S. exports and imports in dollars through May 2010.
Clearly imports are increasing much faster than exports. On a year-over-year basis, exports are up 21% and imports are up 29%. This is an easy comparison because of the collapse in trade at the end of 2008 and into early 2009.
The second graph shows the U.S. trade deficit, with and without petroleum, through May.
 The blue line is the total deficit, and the black line is the petroleum deficit, and the red line is the trade deficit ex-petroleum products.
Import oil prices decreased slightly to $76.93 in May - and are up 96% from the low of February 2009 (at $39.22). Oil import volumes were down in May.
With oil prices and volumes down, oil imports decreased sharply in May, however other imports - especially from China - increased significantly. Most of the increase in the trade deficit since last year has been related to oil, but now it appears the ex-oil deficit is increasing sharply again.


