 RSS Feed
 by Calculated Risk on 5/12/2010 08:30:00 AM
Wednesday, May 12, 2010
Trade Deficit increases in March
The Census Bureau reports:
[T]otal March exports of $147.9 billion and imports of $188.3 billion resulted in a goods and services deficit of $40.4 billion, up from $39.4 billion in February, revised. March exports were $4.6 billion more than February exports of $143.3 billion. March imports were $5.6 billion more than February imports of $182.7 billion.
 Click on graph for larger image.
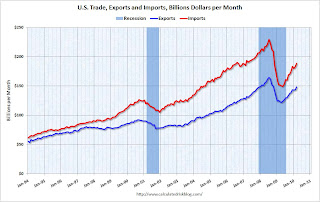
The first graph shows the monthly U.S. exports and imports in dollars through March 2010.
On a year-over-year basis, exports are up 20% and imports are up 24%. This is an easy comparison because of the collapse in trade at the end of 2008 and into early 2009.
The second graph shows the U.S. trade deficit, with and without petroleum, through March.
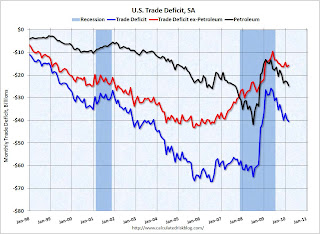 The blue line is the total deficit, and the black line is the petroleum deficit, and the red line is the trade deficit ex-petroleum products.
Import oil prices increased slightly to $73.89 in March - and are up 89% from the low of February 2009 (at $39.22). Oil import volumes increased sharply in March pushing up the value of imports.
Both imports and exports have been increasing sharply, but are still below the pre-financial crisis levels. Once again China and oil are the major contributors to the trade deficit.


