by Calculated Risk on 3/08/2010 11:03:00 PM
Monday, March 08, 2010
Stress Test Update
In the previous post I praised the Fed's short-term liquidity facilities. Another program that I supported was the Treasury's Stress Tests (conducted by the Fed). Here is what I wrote in early 2008:
One of the key elements of the Financial Stability Plan is to build "Financial Stability Trust" by conducting "A Comprehensive Stress Test for Major Banks" and providing investors and the public "Increased Balance Sheet Transparency and Disclosure".and
Although lacking in details, this is a very good idea.
The real answer is to stress test the banks, and put them in three categories: 1) no additional capital needed, 2) some additional capital needed, and 3) preprivatization.Although no banks were placed in the "preprivatize" category (I probably would have preprivatized a couple), these tests were an important step in providing metrics for the banks.
The following graphs compare the actual performance of the U.S. economy versus the two stress test scenarios - baseline and more severe - for GDP, house prices and unemployment.
 Click on graph for larger image in new window.
The first graph shows real GDP (in red) and the two stress test scenarios (baseline and more severe). For this graph I lined up real Q4 GDP.
So far GDP is performing slightly better than the baseline scenario.
It is important to remember that GDP was revised down substantially for 2008 after the stress test scenarios were released.
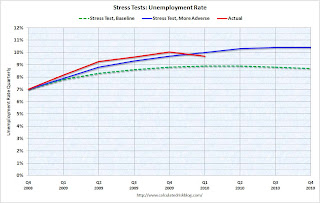
 The second graph is quarterly for the unemployment rate.
For most of the last year the unemployment rate has been higher than the more severe scenario. Now, in Q1 with the unemployment rate at 9.7%, the rate is slightly better than the more severe scenario.
And the third graph is for house prices using the Case-Shiller Composite 10 Index.
 The heavy government support for house prices has kept prices well above the baseline scenario. This has obviously been very beneficial for the banks.
So far the economy is somewhat tracking the baseline scenario (slightly better for GDP, much better for house prices, and worse for unemployment). The key to the stress tests was to establish these metrics and have the banks raise adequate capital to survive the more severe scenario.
One of the problems with the stress tests was that the scenarios ended in 2010. And one of the policies has been to extend and hope (commonly called "extend and pretend") and this has pushed many problems out beyond the horizon of the stress tests.
Also I wouldn't judge the success of the stress tests by these graphs. Just establishing metrics was the key. The criteria for success be if any of the 19 banks get into trouble over the next couple of years and require additional support.


