by Calculated Risk on 9/25/2009 12:16:00 PM
Friday, September 25, 2009
Existing Home Turnover Ratio, and Distressing Gap
For graphs based on the new home sales report this morning, please see: New Home Sales Flat in August
The following graph is a turnover ratio for existing home sales. This is annual sales and year end inventory divided by the total number of owner occupied units. For 2009, sales were estimated at 4.8 million units, and inventory at the August level. Click on graph for larger image in new window.
Although the turnover ratio has fallen from the bubble years, the level is still above the median for the last 40 years. This suggests 2009 is about a normal year for existing home turnover.
That might seem shocking based on all the reports of weak existing home sales. But the problem isn't the number of sales (except as compared to the bubble years), but the type and price of sales.
The reason turnover hasn't fallen further is because of all the distressed sales (foreclosures and short sales) primarily in the low priced areas. Distressed sales declined in August, and this is a major reason existing home sales declined.
There is another wave of foreclosures coming, so existing home sales might stay elevated for some time. Plus, the "first-time" homebuyers tax credit might be extended (a poorly targeted an inefficient credit).
Note: there is a substantial shadow inventory too.
All this distressed sales activity has created a gap between new and existing sales as shown in the following graph that I've jokingly labeled the "Distressing" gap. This graph shows existing home sales (left axis) and new home sales (right axis) through August.
As I've noted before, I believe this gap was caused primarily by distressed sales. Even with the recent rebound in new and existing home sales, the gap is still very wide.
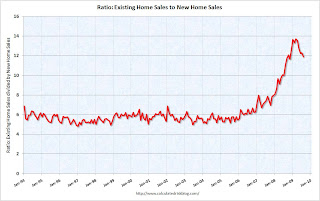
The third graph shows the same information, but as a ratio for existing home sales divided by new home sales. Although distressed sales will stay elevated for some time, eventually I expect this ratio to decline back to the previous ratio.
The ratio could decline because of a further increase in new home sales, or a decrease in existing home sales - or a combination of both. I expect the ratio will decline mostly from a decline in existing home sales as the first-time home buyer frenzy subsides, and as the foreclosure crisis moves into mid-to-high priced areas (with fewer cash flow investors).


