 RSS Feed
 by Calculated Risk on 11/30/2005 08:14:00 PM
Wednesday, November 30, 2005
The Indefatigable Consumer
Should the American consumer be labeled 'indefatigable' or 'incorrigible'? One thing is certain, the consumer crossed the savings Rubicon in the summer of 2005.
First, a warm welcome back to General Glut: How we achieved 4.3%!
As Gen'l Glut points out, personal saving as a percentage of disposable personal income reached -1.5% in Q3 2005. So imagine the line on Dr. Hamilton's graph continuing its descent into negative territory.
The Rubicon has been crossed.
MBA: Refinance Applications Down Again
by Calculated Risk on 11/30/2005 11:14:00 AM
The Mortgage Bankers Association (MBA) reports: Mortgage Application Volume Dips During Holiday Shortened Week
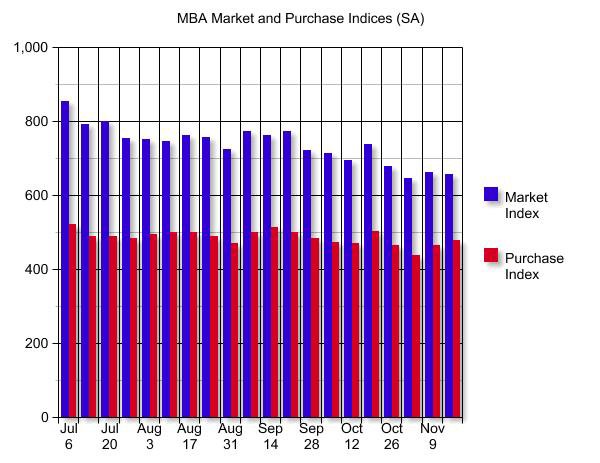
The Market Composite Index — a measure of mortgage loan application volume – was 624.1 a decrease of 1.8 percent on a seasonally adjusted basis from 635.4, one week earlier. On an unadjusted basis, the Index decreased 33.2 percent compared with the previous week but was down 8.0 percent compared with the same week one year earlier. The seasonally-adjusted indexes include an additional adjustment to account for the Thanksgiving holiday.
The seasonally-adjusted Purchase Index increased by 0.8 percent to 476.2 from 472.3 the previous week whereas the Refinance Index decreased by 6.3 percent to 1484.3 from 1584.1 one week earlier.

Click on graph for larger image.
The graph shows overall and purchase activity since June. Overall activity has fallen significantly due to the drop in refis. Purchase activity is steady.
As expected, mortgage rates declined again last week:
The average contract interest rate for 30-year fixed-rate mortgages decreased to 6.20 percent from 6.26 percent on week earlier...Mortgage rates will probably increase this week. Overall this report shows purchase activity is steady at a very high level, but refinance activity continues to decline significantly. It is possible that MEW (Mortgage Equity Withdrawal) is falling rapidly, and this would be expected to impact consumer spending - maybe early next year.
The average contract interest rate for 15-year fixed-rate mortgages decreased to 5.72 percent from 5.83 percent...
See: Real-Estate Boom Soon May Sputter As an Engine of Retail Sales
Tuesday, November 29, 2005
Record October New Home Sales: 1.424 Million
by Calculated Risk on 11/29/2005 10:10:00 AM
According to the Census Bureau report, New Home Sales in October were at a seasonally adjusted annual rate of 1.424 million vs. market expectations of 1.20 million. September sales were revised up to 1.260 million from 1.222 million.
Click on Graph for larger image.
NOTE: The graph starts at 700 thousand units per month to better show monthly variation.
Sales of new one-family houses in October 2005 were at a seasonally adjusted annual rate of 1,424,000, according to estimates released jointly today by the U.S. Census Bureau and the Department of Housing and Urban Development.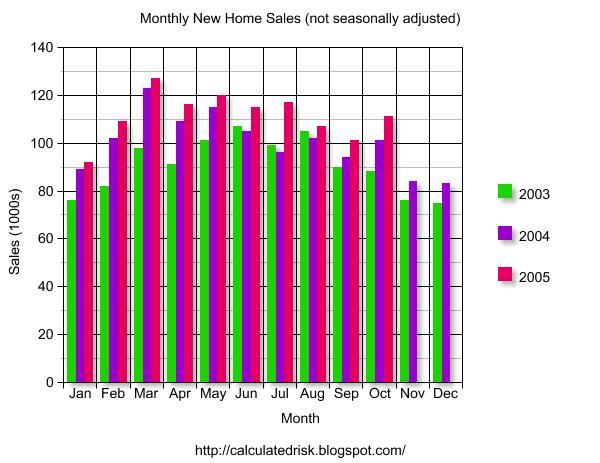
The Not Seasonally Adjusted monthly rate was 111,000 New Homes sold, up from a revised 101,000 in September.
On a year over year basis, October 2005 sales were 10% higher than October 2004.
The median sales price was stable and previous months were revised upwards.
The median sales price of new houses sold in October 2005 was $231,300; the average sales price was $286,500.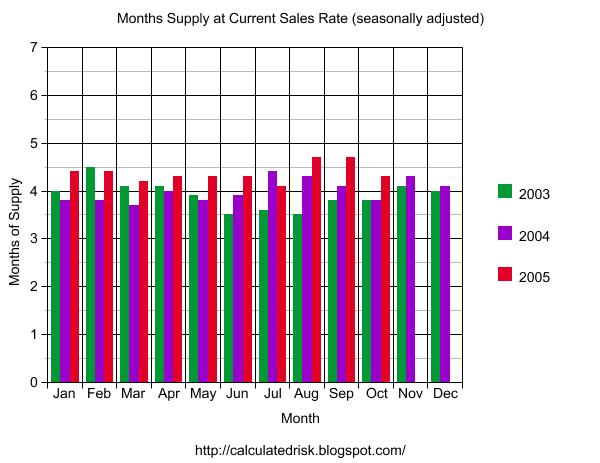
The seasonally adjusted estimate of new houses for sale at the end of October was 496,000. This represents a supply of 4.3 months at the current sales rate.
The 496,000 units of inventory is the all time record for new houses for sale. On a months of supply basis, inventory is at a reasonable level.
This is a very strong report. The pronouncements of the demise of the housing market now appear premature.
Monday, November 28, 2005
Second Homes
by Calculated Risk on 11/28/2005 05:44:00 PM
Here are two commentaries on second homes ...
Dr. Robert Shiller writes: Home sweet second home
...the world is undergoing a second-home boom: an increasing number of people are buying vacation homes in beautiful and fun places that are within a few hours’ flying time from their first homes and jobs. Their second homes are a retreat where they will spend only a fraction of the year, and recently pristine mountain ridges and ocean cliffs are being dotted with new homes to meet the demand.Fannie Mae Economist David Berson asks: What would the housing market have looked like if investor and second home demand had been more normal?
...
Some of the US counties with a high proportion of vacation homes are seeing price increases that rival, if not outstrip, the booming metropolitan areas.
...
There is reason to worry about this. ... in some places, a speculative bubble is fueling today’s boom in vacation-home prices. The vacation-home boom appears psychologically tied to the urban home-price bubble in many of the world’s “glamour cities,” and prices of these vacation homes are similarly vulnerable to a significant drop in coming years.
Data from Loan Performance indicate that the share of purchase originations going to investor and second home buyers has been trending upward for the past decade or so, with a significant acceleration beginning in 2003 -- although the modest decline in the investor share in the most recent quarter may be a sign that this trend is beginning to end (see Figure 1). The low share of investor/second home activity in the early-mid 1990s, however, was likely a reaction to the drop in home prices over that period, and so was below sustainable levels. Moreover, demographics suggest that second home demand should be rising, given the large share of the population between 45-60 years of age -- the prime second home buying years. As a result, an investor/second home share of 10-13 percent might be sustainable -- not the more than 20 percent current share. The lower end of this range represents the investor/second home share in 2002 (just before the recent boom began), while the upper end represents a continuation of the longer-term 1997-2002 trend.

Figure 2 shows our estimate of total home sales if the investor/second home share had either remained at the 2002 level of 10 percent, or had increased more modestly to 13 percent by the middle of 2005 -- compared with actual sales. Over the two-and-a-half year period from the beginning of 2003, total home sales would have been 17.9 million units instead of the actual sales of 19.3 million units over that period if the investor/second home share had stayed flat at 10 percent (a drop of 7.3 percent, or 1.4 million fewer units). Using the assumption that the investor/second home share would have increased to 13 percent by the middle of 2005, total sales would have been 18.2 million units (a drop of 5.7 percent, or 1.1 million fewer units).

In either scenario, home sales would have been considerably less than the actual figure since 2003 if the investor/second home share hadn’t skyrocketed in the past couple of years. Next week’s commentary will look at what the future path for home sales could be if the investor/second home share returns to a more normal level over the next year.
Existing Homes: Sales Fall, Inventory Increases
by Calculated Risk on 11/28/2005 10:04:00 AM
A few comments for October:
Existing Home Sales fell 2.7% to 7.09 million annual rate.
Inventories increased 3.5% to 2.87 million. This represents 4.9 months of supply. Although inventories are at record levels, the months of supply is still within the normal range because of the strong sales activity.
Inventories are up 16.3% since last October.
Both median and average prices were solid and rebounded from last month. The median prices was $218K, up from $213K in September and just below the record set in August of $220K.
The average price $267K, up from $261K, and just below the August record of $269K. Prices are not seasonally adjusted and it is normal for prices to fall a little from the summer peak.
The AP reports: Existing Home Sales Decline in October
"This signals that the housing sector has likely passed its peak. The boom is winding down to an expansion," said David Lereah, chief economist for the Realtors.Mortgage rates have fallen for two consecutive weeks and might fall further this week. For an interesting discussion on the flattening yield curve, see Dr. Hamilton's: Inverted yield curve edges closer
...
Lereah predicted that housing activity would cool further in coming months if, as expected, the Federal Reserve keeps pushing interest rates higher to combat rising inflation pressures that have been triggered by a surge in energy prices.
Those price increases have contributed to a rise in mortgage rates although rates retreated a bit last week to 6.28 percent from 6.37 percent the previous week, which had been the highest level in two years.
"We feel confident that housing is landing softly as rates continue to rise," Lereah said.
Some economists had expressed fears that rising mortgage rates could burst the housing bubble much as a speculative bubble in Internet stock prices burst in early 2000, sending shockwaves throughout the economy.
Politics: Steve Young for Congress
by Calculated Risk on 11/28/2005 01:17:00 AM
Those of us living in California's 48th Congressional District are suffering election fatigue. Our Representative, Christopher Cox, is the new SEC Chairman and his congressional seat is vacant.
We will now be voting in our third election in just over two months: October 4th was the district primary and November 8th was the California statewide special election. The General Election is Dec 6th.
Steve Young for Congress
The 48th District has historically voted Republican and will likely go to Republican John Campbell. But Democrat Steve Young has a chance. Young has an excellent organization and it is possible that the GOP vote will be split between Campbell and Minuteman founder Jim Gilchrist.
I've spoken with the Campbell campaign. They told me he is fiscally responsible and strongly supports President Bush's economic policies. When I started laughing at the contradiction, they knew they had lost my vote.
I believe Steve Young offers a reasonable alternative for change.
A friend of mine attended the Steve Young pancake breakfast this morning and emailed this summary:

My wife and I attended this morning's pancake breakfast for Steve Young. The turnout was good and supportive of what he is trying to do. There were several speakers that offered their support. Tom Umberg, Frank Barbaro and Pat Kelly were enthusiastic about Young's chances provided that the Democrats come out and vote. Kelly, who is Secretary Treasurer of Teamsters Union local 952 indicated that a strong effort is needed to have Democrats from all over the nation come to the support of Young. A victory in this traditional Republican area would do a lot to energize the Democratic party.The campaign needs money and volunteers to make phone calls to get out the vote: (949) 640-4400
...
Again it was stressed that the turnout for this election will be very small. With Gilchrist expected to garner some of the votes that would go to Campbell a significant vote of registered Democratic voters will make Young a winner.
...
PS - the pancakes were good.
P.S. This will be an interesting week for housing data. Both New and Existing home sales will be reported this week and the Q3 OFHEO House Price Index will be released Dec 1st.
Sunday, November 27, 2005
Housing: Exotic Loans, Regulation and Foreclosures
by Calculated Risk on 11/27/2005 01:40:00 PM
These three articles seem to go together ...
The AP reports: Mortgage packages head into iffy stage
With the housing market cooling and loan demand shrinking, banks and other lenders are turning to nontraditional and sometimes riskier mortgages to bring in more business and make up their lost revenue.The Philadelphia Inquirer reports: New rules coming on 'exotic' mortgages
...
Many lenders have turned to mortgage products designed to lower monthly loan payments and to help borrowers qualify more readily for larger loan amounts, while others require little in the way of documentation during the approval process. These loans do make it easier for some people to get mortgages, but they also can raise the possibility that some borrowers may end up in default.
In the first six months of the year, demand for alternative adjustable-rate mortgages, also known as Alt-A or option ARMs, and interest-only mortgages increased as the difference in interest rates for standard ARMs and fixed-rate mortgages narrowed, said Doug Duncan, chief economist for the Mortgage Bankers Association of America in Washington.And the North County Times (San Diego) reports: As housing price increases slow, more mortgages going into default
The share of first-mortgage originations that were interest-only loans rose to 23 percent from 17 percent during the same period last year, and the Alt-A share increased to 11 percent from 8 percent.
...
"The markets with a high percentage of these loans are more fragile to shocks such as rising interest rates," [National Association of Realtors' chief economist David] Lereah said last month during the Realtors' convention in San Francisco.
Lereah went to the Office of the Comptroller of the Currency, which oversees the nation's banks, "to talk about the behavior of lenders who are offering these exotic mortgages."
"I'd like to see more guidelines on the percentage of these loans that can be issued, even if it slows home sales, to ensure a soft landing for the market," he said.
He found that he and the comptroller, John C. Dugan, were on the same page. New guidelines on nontraditional loans are due Jan. 1 ... (emphasis added)
Foreclosure activity has edged up in recent months, providing yet another small but clear sign of cooling in Riverside County's housing market. Banks and other lenders sent 1,266 notices of default to Riverside County borrowers in the third quarter, a move that gives homeowners 90 days to catch up on payments before moving towards an auction, according to La Jolla-based DataQuick Information Systems. That number is up from 1,121 in the second quarter and 1,116 notices in the third quarter of 2004.
The shift reflects a return toward historical averages and comes amid signs that Southwest County's real-estate party is winding down.
"Even now, the level of foreclosure activity is unnaturally low," DataQuick analyst John Karevoll said.
Homeowners, particularly first-time homebuyers in suburban markets such as Southwest County, always face a certain amount of financial distress, Karevoll said. That's particularly true now, with adjustable-rate mortgage payments rising faster than salaries. The median monthly payment in October was $2,169, up 20 percent from October 2004, according to DataQuick.
NRF: Retail Sales Strong
by Calculated Risk on 11/27/2005 11:58:00 AM
The NY Times reports: Initial Reports Are Mixed for Retail's Busiest Day
Two reports measuring consumer spending for Friday, both released last night, painted an unusually muddy portrait of what has become the busiest shopping day of the year.
Sales Draw Shoppers ShopperTrak, a national survey firm, said sales for the day after Thanksgiving - called Black Friday in the industry because of hopes that it will catapult retailers into the black for the year - fell 0.9 percent over last year, to $8.01 billion.
Visa USA, on the other hand, reported that use of its credit cards had risen 13.9 percent.
Both companies characterized the results as a healthy start to the season, but the wide gap between them raised questions about the strength of the holiday shopping period, which accounts for as much as 25 percent of annual sales for the retail industry.

Click on drawing for larger image.
Drawing from Elaine Supkis.
Meanwhile, the National Retail Federation was very upbeat: Blockbuster Black Friday Weekend Sees Sales Near $28 Billion
The ceremonial kickoff to the holiday season began with a great deal of fanfare as 145 million shoppers flooded stores and the Internet hunting for popular electronics, clothing, and books. An NRF survey conducted by BIGresearch found that the average shopper spent $302.81 this weekend, bringing total weekend spending to $27.8 billion, an incredible 21.9 percent increase over last year's$22.8 billion.
As expected, retailers offered substantial discounts and savings on Black Friday to bring people into their stores and consumers held up their end of the bargain by going shopping, said NRF President and CEO Tracy Mullin. Even though many retailers saw strong sales this past weekend, companies will not be basking in their success. Stores are already warming up for the next four weeks because the holiday season is far from over.
More than 60 million shoppers headed to the stores on Black Friday, an increase of 7.9 percent over last year. Another 52.8 million shopped on Saturday, a rise of 13.3 percent over 2004. The number of shoppers out today is expected to be close to last year, with about 22 million people shopping.
Friday, November 25, 2005
WaPo on Housing: How to Sell In a Down Cycle
by Calculated Risk on 11/25/2005 11:28:00 PM
The Washington Post offers advice on housing: How to Sell In a Down Cycle
Pretty much everybody in real estate knows what's up ... the boom is well past its peak.Its amazing that "4 to 5 percent appreciation" is considered disappointing. I would consider flat nominal prices for a few years as a "soft landing" for housing.
...
Instead of double-digit appreciation rates, look for 4 or 5 percent appreciation in 2006. Instead of mortgage rates at historic lows, look for conventional 30-year rates in the 7 to 8 percent range and a couple of points higher for subprime borrowers. Plan for slower-moving sales, more unsold housing inventory sitting on the market and scaled-back listing prices.
This is the "soft landing" scenario that many, but hardly all, economists expect to be the final phase of the current cycle. Others forecast harder landings if interest rates get out of hand in the frothiest cities of the West and East coasts.
Also, I think the WaPo article misses the key point in a down cycle: If you think prices are going to decline, and you NEED to sell, DON'T chase the prices down. Sell now at a discounted price.
The housing market tends to be inefficient because real estate prices display strong persistence and are sticky downward. Sellers tend to want a price close to recent sales in their neighborhood, and buyers, sensing prices are declining, will wait for even lower prices. This means real estate markets do not clear immediately, and what we usually observe is a drop in transaction volumes.
To be a successful seller in a down cycle, you must adjust your price down quicker than your competitors. Even though transaction activity will fall in a down cycle, a seller is only concerned with one transaction!
A final comment: Although I think the peak of the boom (in transactions) probably occurred last summer, I'm not sure the price boom is over yet. Inventories are rising, but activity is still strong in many areas. The reports this comming week on New and Existing Home sales, and Q3 prices from OFHEO, will be interesting.
Wednesday, November 23, 2005
Housing: More Inventory
by Calculated Risk on 11/23/2005 11:21:00 PM
The Orlando Sentinel reports: Housing inventory balloons
The number of homes for sale in the Orlando area ballooned by more than 2,200 properties last month to hit an eight-year high -- the clearest sign yet that the region's red-hot housing market might be about to cool off. ... the inventory of available homes jumped from 6,786 at the end of September to 8,992 at the end of October, according to the Orlando Regional Realtor Association. That's the largest inventory since 9,129 homes were for sale in May 1997.But sales activity was still strong and prices set a new record:
Orlando's existing-home sales remained strong in October ... Completed deals in the four-county metro area were up more than 27 percent from October 2004, and the median price of those sold in the market's core crept up for the first time in three months to set another record.That is just over 3 months of inventory without seasonally adjusting sales. On an adjusted basis (the usual number) inventory is probably well under 3 months - still well below normal.
...
With the completion of 2,841 resales in October, the metro area was still running 12.4 percent ahead of last year's record sales pace. And after stalling in August and falling slightly in September for the first time in a year, the median home price in the market's core rose in October from $243,900 to $246,790.
MBA: Refinance Applications Down Strong
by Calculated Risk on 11/23/2005 11:04:00 AM
The Mortgage Bankers Association (MBA) reports: Mortgage Refinance Applications Down 17.4 Percent Since Last Month
The Market Composite Index — a measure of mortgage loan application volume – was 635.4, a decrease of 3.4 percent on a seasonally adjusted basis from 657.6 one week earlier. On an unadjusted basis, the Index increased 4.8 percent compared with the previous week, but was down 11.8 percent compared with the same week one year earlier.
The seasonally-adjusted Purchase Index decreased by 1.2 percent to 472.3 from 477.9 the previous week whereas the Refinance Index decreased by 6.9 percent to 1584.1 from 1702.4 one week earlier. The Refinance Index is down 17.4 percent compared to four weeks ago when the index was 2144.5.

Click on graph for larger image.
The graph shows overall and purchase activity since June. Overall activity has fallen significantly due to the drop in refis. Purchase activity is steady.
As expected, mortgage rates declined last week:
The average contract interest rate for 30-year fixed-rate mortgages decreased to 6.26 percent from 6.33 percent one week earlier...
The average contract interest rate for one-year ARMs decreased to 5.41 percent from 5.46 percent one week earlier...
Tuesday, November 22, 2005
FDIC: Mortgage Loan Growth Strong
by Calculated Risk on 11/22/2005 11:16:00 AM
The Federal Deposit Insurance Corporation (FDIC) released their
Quarterly Banking Profile for the third quarter 2005. On Real Estate lending:
Residential mortgage loan growth remained strong, while growth in real estate construction lending is accelerating. One- to four-family mortgage loans increased by $66.6 billion (3.4 percent) in the third quarter. Loans for real estate construction and land development grew by $28.2 billion (7.2 percent) during the quarter, and have increased by 30.9 percent over the past 12 months.But Home Equity lending has flattened out:
In contrast, home equity loan growth, which was proceeding at an annual rate of 46 percent a year ago, has slowed considerably in 2005. During the third quarter, home equity loans increased by only $4.3 billion (0.8 percent), the smallest quarterly increase in more than four years.
Monday, November 21, 2005
Fannie Mae: Home affordability suffers
by Calculated Risk on 11/21/2005 10:32:00 AM
Fannie Mae's Molly R. Boesel writes: Home affordability suffers as home prices and interest rates rise.
Affordability has dropped sharply over the past 18 months despite low mortgage rates and a pickup in income growth. The National Association of Realtors’ (NAR) housing affordability index is at its lowest level since 1991 (and, using our own calculations, affordability has fallen to the lowest levels since the early-to-mid 1980s in some high cost areas). The NAR first-time homebuyer index is at its lowest level since 1985. What has caused this decline in affordability? We don’t have to go far to find the cause: the unprecedented rise in home prices. Dramatic increases in investor/second home purchases, looser overall underwriting, and the proliferation of low initial-payment ARM mortgages have all contributed to a surge in home prices relative to income growth. With further increases in mortgage rates anticipated over the next year, affordability should drop further.Just a note - it appears mortgage rates dropped last week and might drop further this week. I'm not suggesting rates have topped, but it is possible (edit: possible short term) and that would help support house prices.
The chart below shows the NAR composite affordability index for the United States as a whole and the four Census Regions through September. An index value of 100 means that a family earning the median income has exactly enough income to qualify for a mortgage on the median-priced home -- and thus that it can afford to purchase 100 percent of the median-priced home. The September U.S. index value of 119.4 indicates that the typical family has 19.4 percent more income than needed to qualify for the median-priced home.

While affordability increased a bit in September, it is still well below year-ago levels, and the trend is clearly downward. Moreover, the biggest portion of the recent increase in mortgage rates has occurred over the past two months -- suggesting that the affordability index will decline once those higher rates are factored in. The last time the national affordability index was this low was when mortgage rates were around nine percent (in 1991). Regional affordability indices have also fallen, especially in the West.
How much of the drop in affordability has been due to house price increases and how much to increases in mortgage rates? The national affordability index fell by 19 points from September 2004 to September 2005. Over that time the median existing home price increased by over 14 percent and the prevailing mortgage rate increased by 20 basis points. Holding income constant, and alternatively holding the median sales price and prevailing interest rates constant, we find that 85 percent of the decline in the index over the past year came from the increase in the median sales price. Mortgage rate increases have been modest over the past year, while increases in income have outweighed any loss in affordability from the rise in rates.
WSJ on Housing: What's Behind the Boom
by Calculated Risk on 11/21/2005 01:12:00 AM
From the WSJ: What's Behind the Boom James Haggerty of the WSJ looks at the future for the housing market:
Almost everyone agrees that prices can't keep rising this fast much longer. The debate now is whether the boom will lead to a soft landing, with gentler price increases, or to a long, painful bust, in which prices fall considerably in some places before buyers regain confidence.If you are looking for an answer to the hard or soft landing question, Mr. Haggerty doesn't provide it. But he does provide an overview of ten factors impacting housing - from limited space in certain areas to risky loans to homeowners using their homes as a "piggy bank".
However the current boom ends, longer-term forces are reshaping the housing industry. Here is a look at some of them.
Haggerty does offer this chart to show that housing might not be overvalued (at the median):

If that 2nd chart is supposed to be comforting, I'm not sure why. Not only is "affordability" dropping rapidly, but the index is at levels not seen since the last housing bust in the early '90s!
Sunday, November 20, 2005
Real Estate Employment
by Calculated Risk on 11/20/2005 09:32:00 PM
My weekly post on Angry Bear: Construction Employment in the Inland Empire
Added from Dr. Thoma - A funny photo: The Consumption Boom
And in a related story from Reuters: Californians gamble on career in real estate
Real estate bubble or not, more and more Californians are betting on a future in selling homes.
Realtor hopefuls are arriving every day -- a troubling trend for veterans, say economists who note that there soon will not be enough homes for sale to support all the newcomers.
Nearly 2 percent of adults in California hold a license to sell residential property in the state, where $30,000 commissions on million-dollar homes have become commonplace.
...
"Some of these agents will be flushed out" of the industry, said economist Stuart Gabriel, director of the Lusk Center for Real Estate at the University of Southern California.
"It's difficult to imagine that there will be an adequate volume of home sales" that would sustain the new arrivals, he said.
Since the beginning of 2004, statewide sales activity among existing single-family homes has risen 2 percent, according to the California Association of Realtors. But during the same period, the population of agents grew 26 percent.
...
"There's a precarious situation out there right now," he said, citing frustration among novices who find themselves regularly outfoxed by more seasoned realtors.
Rohrbach added that if sales slow even moderately, "it's going to be more and more difficult for them to be earning a living wage."
Saturday, November 19, 2005
Housing and Employment
by Calculated Risk on 11/19/2005 08:34:00 PM
Four articles on Housing and Employment.
From the NY Times: As the McMansions Go, So Goes Job Growth
THERE'S a growing consensus that the housing market is cooling off. ... ... in recent years, housing, real estate and the related industries have become a huge factor in another crucial economic area: employment growth.And now from the LA Times on California: State Posts Tepid Job Growth
After the brief and shallow recession of 2001, the resilient United States economy stubbornly failed to create payroll jobs at the rate of past recoveries. ... amid the gloom, the real estate sector shouldered the burden of job creation.
Asha Bangalore, an economist at Northern Trust in Chicago, tallied figures from the Bureau of Labor Statistics for sectors like construction, building material and garden supply stores. She found that from November 2001 to October 2005, housing and real estate accounted for a whopping 36 percent of private-sector payroll job growth. "In four years, 2.3 million private-sector jobs were created in the U.S., and 836,000 were related to the housing sector," she said.
...virtually all the labor associated with housing - the roofers, the investment bankers who securitize mortgages into bonds, the clerks at Home Depot - is based in the United States.
As a result of the boom, the economy is more concentrated on housing than ever before. "Residential investment as a share of gross domestic product is at the highest level in 50 years," said Jan Hatzius, senior economist at Goldman, Sachs.
Mark Zandi, chief economist at Economy.com, notes that real-estate-related industries accounted for 9.7 percent of total domestic employment in the second quarter of 2005, up from 9.0 percent in the fourth quarter of 2001. And in areas with the hottest markets, housing plays an even more important role. In California, 13.4 percent of jobs in the second quarter of 2005 were housing-related, versus 12.3 percent in the fourth quarter of 2001. In Las Vegas, the figure rose to 14.6 percent from 12.9 percent; in Panama City, Fla., it rose to 15.4 percent from 11.7 percent.
So what should we expect, now that housing appears to be cooling off?
... "Housing and the job markets are joined at the hip," Mr. Zandi said. "And if housing cools, so too will hiring and the job market more broadly, particularly in the more juiced-up housing markets."
If housing prices are flat in 2006 and residential investment falls 5 percent, there could be a direct loss of a few hundred thousand jobs related to real estate, Mr. Hatzius said. And the indirect effects will certainly be larger, Mr. Zandi said: "Housing is going to go from being a key contributor to the job engine to being a significant drag on job growth."
But there's some good news. Ms. Bangalore notes that while housing's contribution to job growth has declined in recent months, "other sectors are picking up the slack."
Can [California] weather a softening housing market?And in Orange County, California, from the OC Register: O.C. Unemployment up as job growth slows
The real estate sector, including construction, mortgage finance and home sales, has been the state's single largest engine of job growth. Construction added 63,400 jobs in the last year, nearly double the 32,400 jobs added by the next-strongest category,
leisure and hospitality.
But amid rising mortgage rates, home price increases are stalling and sales activity is slowing. Homes are staying on the market longer, as sellers find it harder to get their asking prices. These factors could result in slowing job gains or even job losses like those that hit Orange-based Ameriquest Mortgage Co., which said Thursday it would cut 10% of its workforce nationwide.
Construction employment in the county fell by 1,100 in October to 98,300 ... Financial activities, which include real estate, posted a slight increase of 100 jobs in October, but the number was unchanged from a year earlier at 132,500.And finally, the Ameriquest announcement: Ameriquest parent cuts jobs
"We expected construction and financial activities to show gradual slowness in terms of job growth, and that's kicking in," said Esmael Adibi, an economist with Chapman University's A. Gary Anderson Center for Economic Research.
...
The figures released Friday don't reflect two big layoffs by Orange County companies this week.
On Thursday, ACC Capital Corp., the Orange-based parent of Ameriquest Mortgage, laid off 1,500 people nationwide. On Wednesday, Anaheim's Automotive Caliper Exchangeshut down, putting 300 people out of work. The impact of those layoffs should show up in November employment figures that EDD will release next month.
ACC Capital Holdings, the Orange-based parent of Ameriquest Mortgage Corp., said Thursday that it is laying off about 10 percent of its staff, or about 1,500 people nationwide.
"The mortgage industry is entering a challenging phase of rising interest rates," ACC Capital said in a statement. "In response to these changing market conditions, the ACC Capital Holdings family of companies is reducing its current workforce by
approximately 10 percent. In cyclical industries such as mortgage lending, periodic workforce reductions are not uncommon."
Friday, November 18, 2005
Thoughts on Housing Starts
by Calculated Risk on 11/18/2005 07:12:00 PM
Much has been made about the Seasonally Adjusted October drop in housing starts and permits reported yesterday. As an example, Reuters reported:
"A sharp drop in U.S. housing starts and permits for new building in October pointed to some cooling in the red-hot real estate market...".And the Indianopolis Star headline screamed:
"Housing starts plunge in October"But did starts really "plunge"?
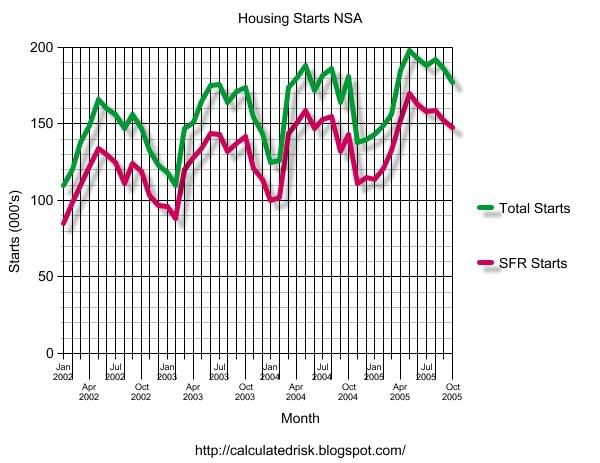
Click on graph for larger image.
This graph shows the NSA housing starts for the last four years. Every year housing starts decline in the fall, yet the October housing starts are still near the peak summer pace for 2004. That is hardly a plunge.
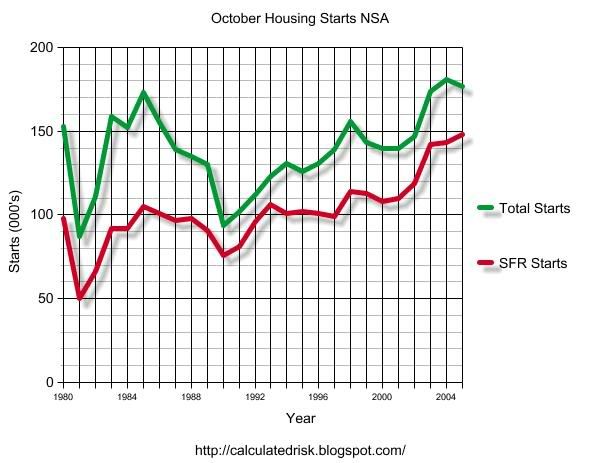
The second graph shows October housing starts since 1980.
Total starts in Oct, 2005 showed a small decline from Oct, 2004. But for one unit structures (SFR), 2005 was an all time record for October starts.
Hardly a plunge.
With rising inventories and rising interest rates, it is understandable that analysts are looking for confirmation that the housing market has slowed substantially. This isn't it.
Besides, permits and housing starts are historically lagging indicators for a housing slowdown. In addition to rising inventories, I believe the more timely indicators are falling mortgage applications and declining sales.
ARMs Coming Due
by Calculated Risk on 11/18/2005 05:47:00 PM
CNN reports: Homeowners with ARMs face big bill jump
The Mortgage Bankers Association estimates that some $330 billion worth of ARMs will adjust in 2006 and $1 trillion worth will reset by the end of 2007.For more details on adjusting ARMs, see this NY Times article from June: The Trillion-Dollar Bet
Since the average ARM loan is about $300,000, according to Freddie Mac, a trillion dollars probably represents more than 3 million homeowners who will face bigger bills in the next two years.
If you took out an 3/1 ARM for $300,000 back in late 2002, your initial interest rate was probably around 5 percent and your monthly payment has been about $1,610.
...
Your new payment: $1,995 a month -- a difference of $385, or more than $4,600 a year.
Financial Times: Opec set to lift secrecy about oil production
by Calculated Risk on 11/18/2005 05:13:00 PM
The Financial Times reports:
The Organisation of the Petroleum Exporting Countries, the cartel that controls 40 per cent of world oil exports, will on Saturday lift a four-decade veil of secrecy and begin regularly to reveal how much oil it is actually pumping.More transparency is a positive for the oil market, but it doesn't appear this will lead to more transparency on reserves - the key to peak oil predictions.
China and India, the fastest growing major oil consumers, will also supply consumption and storage data for the first time.
The Joint Oil Data Initiative (Jodi), which will be launched on Saturday in Riyadh by energy and finance ministers of the biggest oil producing and consuming countries, will meet a persistent demand of the Group of seven industrialised countries for more transparent energy data.
The price rise of the past three years, which this year saw oil hit nominal highs of $70.85 a barrel, could in part have been avoided by better data, analysts said. It would provide a more accurate basis for industry investment decisions, which in turn help determine long term supplies.
But analysts also suggested that the new database was unlikely to transform the currently unscientific art of guessing world demand and supply into a simple task.
One person close to Saturday's event said that the data would reveal little difference to existing output estimates for some countries including Saudi Arabia, the world's biggest oil producer but would show a five to 10 per cent disparity in the production levels of other Opec countries.
Traders said they would have to wait until the numbers came out to know whether they would move the oil price when markets reopen on Monday.
Thursday, November 17, 2005
More on California Bay Area Housing
by Calculated Risk on 11/17/2005 10:15:00 PM
The SF Chronicle on the DataQuick report: Gaming the housing peak
A few added quotes:
"I don't get the feeling that prices have declined," [a potential buyer] said. "Homeowners are seeking prices that are in line with comps (comparable listings) of homes that sold a few months ago.''
John Karevoll, an analyst with DataQuick, said that is exactly what happens at the end of a real estate cycle. "We always see people trying to game the peak -- trying to get the most for their properties,'' he said.
According to Karevoll, this doesn't indicate a housing bubble about to burst but rather the end of a cycle in which sales will drop off and prices will reach a plateau.
In effect, the market had been robust because house seekers who would have waited to buy purchased this year instead because of low interest rates. "We were stealing (housing activity) from the future,'' he said.
Karevoll now expects a long lull in the market as it stabilizes.
Tapan Munroe, an economist and director for LECG, a worldwide consulting firm, agreed. "Sales are flattening, and prices are also going down a bit, but I doubt very much it is a bursting of a bubble. It's more like a slowdown and a soft landing.''
But Munroe said the situation could change if interest rates were to reach 7 to 8 percent. "That would certainly create a significant slowdown.''
Economists say U.S. housing market in downdraft
by Calculated Risk on 11/17/2005 04:41:00 PM
Reuters reports: Economists say U.S. housing market in downdraft
The U.S. housing market has peaked and a slowdown appears underway after a five-year rally that toppled all construction and sales records and sent home prices soaring, economists said on Thursday.But its not all doom and gloom:
A string of new economic data from the government and private sector show rising interest rates tugged the reins on housing activity in October and the first part of November.
The Commerce Department said on Thursday both home construction and permits for future building tumbled last month while an industry group said mortgage applications slid last week as rising interest rates dampened home buyers' demand.
Those reports follow a host of data over the past month indicating an increase in the supply of homes for sale, waning demand and some falling prices.
Add to that growing anecdotal evidence that homes are staying on the market longer and buyers are bidding below sellers' asking prices, and it cements an impression that the long-anticipated cooling has begun.
"All of that suggests this is now a buyers' market," said Nariman Behravesh, chief economist at Global Insight. "It is a big change from a year ago."
"The level of housing activity remains quite solid but we just might be seeing the end of the boom," said Joel Naroff, president and chief economist at Naroff Economic Advisors Inc.But there is concern about the impact on the overall economy:
...
"It's not like it's going to be a lousy market for housing next year," said Frank Nothaft, chief economist at Freddie Mac. "It will just be normal as opposed to these abnormal levels we've seen these last couple years."
Softening in the housing market will have a spillover effect on the broad economy and is likely to play a major role in an expected slide in consumer spending in the months ahead.
Real personal consumption expenditures -- about 70 percent of gross domestic product -- are forecast to grow just 2.8 percent next year, slower than this year's 3.5 percent and the smallest increase since 2002, according to the Blue Chip survey of more than 50 top forecasters.
DataQuick on Bay Area: Lower Sales, Flat Prices
by Calculated Risk on 11/17/2005 03:16:00 PM
DataQuick reports: Continued sales slowdown in Bay Area, appreciation flat
The number of homes sold in the nine-county Bay Area declined on a year-over-year basis for the seventh month in a row in October, the result of rising mortgage interest rates and reduced demand, a real estate information service reported.
A total of 10,508 new and resale houses and condos were sold in the region last month. That was down 6.2 percent from 11,205 for September, and down 6.0 percent from 11,180 for October last year, according to DataQuick Information Systems.
Sales have been lower compared to 2004 every month since April. So far this year 107,099 Bay Area homes have been sold, 5.1 percent fewer than 112,873 for the same ten-month period last year.
"We look at today's market as normalizing. Everybody seems to have gotten used to the records set last year and the year before. The fact is that last month was the third-strongest October since we started keeping records in 1988. It was about twenty percent above average," said Marshall Prentice, DataQuick president.
The median price paid for a Bay Area home was $614,000 last month. That was down 0.3 percent from $616,000 in September, and up 17.2 percent from $524,000 for October a year ago. Annual price increases so far this year have ranged from 17.2 percent to 20.5 percent.
West Coast Ports: October Imports Mixed, Exports Up
by Calculated Risk on 11/17/2005 10:32:00 AM
The Ports of Long Beach and Los Angeles reported mixed import traffic for October.
Import traffic at the Port of Long Beach decreased 4.5% compared to September. A total of 299 thousand loaded cargo containers came into the Port of Long Beach, compared to 313.5 thousand in September.
The Port of Los Angeles import traffic increased 5% in October. Imports were 368.8 thousand containers, setting a new all time record for the Port of Los Angeles.
For both ports, outbound traffic recovered from the September slump. For Long Beach, outbound traffic was up 6.6% to 103 thousand containers. At Los Angeles, outbound traffic was up 5.5% to 98 thousand containers.
The quantity of containers says nothing about the content value, but provides a rough guide on imports from China and the rest of Asia. Given these numbers, I expect imports from Asia to be about the same in October as in September.
Wednesday, November 16, 2005
NAHB: Builder Confidence Falls
by Calculated Risk on 11/16/2005 02:11:00 PM
The National Association of Home Builders reports: Builder Confidence Declines In November
Responding to sharply lower measures of consumer confidence as well as rising mortgage rates and other factors in recent months, single-family home builders are adjusting their market expectations downward to a still favorable perspective, according to the National Association of Home Builders/Wells Fargo Housing Market Index (HMI) for November, released today.Here is the table of the HMI components.
The index declined eight points to rest at 60, a level well above the midpoint that indicates the majority of builders still see conditions as positive in their markets.
“It’s important to keep today’s report in perspective,” said NAHB President Dave Wilson, a custom home builder from Ketchum, Idaho. “Many builders still have substantial backlogs of unfilled orders and will remain quite busy in coming months. But we’re well aware that some slowing of demand is inevitable following the record-breaking sales activity that has prevailed for some time.”
“No huge drop is in the cards – the sharp decline in the HMI probably overstates the actual degree of deterioration in the single-family market, and it’s most likely that we’re engaged in an orderly cooling process that will lead to somewhat lower home sales and production in the future,” added NAHB Chief Economist David Seiders. “We’re looking for a 5 or 6 percent decline in home sales next year, compared to 2005.”
Derived from a monthly survey that NAHB has been conducting for approximately 20 years, the NAHB/Wells Fargo HMI gauges builder perceptions of current single-family home sales and sales expectations for the next six months as either “good,” “fair” or “poor.” The survey also asks builders to rate traffic of prospective buyers as either “high to very high,” “average” or “low to very low.” Scores for each component are then used to calculate a seasonally adjusted index where any number over 50 indicates that more builders view sales conditions as good than poor.
Each of the HMI’s component indexes registered declines this time around. The index gauging current sales activity fell eight points to 66, while the index gauging sales expectations for the next six months dropped nine points to 64 and the index gauging traffic of prospective buyers fell five points to 46.
Seiders cited deterioration in consumer attitudes in recent months, spurred by the recent hurricanes and resulting higher energy prices, as a significant factor in November’s builder confidence gauge. He also cited rising interest rates on both fixed- and adjustable-rate mortgages. Fixed rates averaged 6.35 percent in the survey period compared to 6 percent in the prior month and 5.7 percent in the month before that.
“In addition, affordability problems have arisen as house price gains have accumulated in many parts of the country,” he said. “So while the balance of builder attitudes is still positive, most are less exuberant than at the HMI’s last peak in the middle of this year” (the index hit 72 in June). The last time the HMI hit 60 was in May of 2003.
Though builder confidence was down across all regions of the country, ongoing trends prevailed to keep those in the West at the highest end of the confidence scale and those in the Midwest at the lower end. In the West, the HMI fell from a very high level of 91 in October to a still-impressive 78 in November, while in the South, it declined from 76 to 68. In the Northeast, the gauge slipped six points to 61, while continued job-market weakness in the Midwest brought that region’s HMI down from 45 to 38.
MBA: Mortgage Activity Steady
by Calculated Risk on 11/16/2005 11:30:00 AM
The Mortgage Bankers Association (MBA) released its weekly survey today:
The Market Composite Index — a measure of mortgage loan application volume – was 657.6 a decrease of 0.6 percent on a seasonally adjusted basis from 661.3, one week earlier. On an unadjusted basis, the Index decreased 12.1 percent compared with the previous week and was down 13.7 percent compared with the same week one year earlier.
Click on graph for larger image.
This graph show the seasonally adjusted MBA Market and Purchase indices since the beginning of July. The market index had been steadily declining for several months, mostly reflecting a slowing in refinance activity, but has been flat over the last couple of weeks.
The purchase index had stayed steady, reflecting the continued strength in new and existing homes sales. The Purchase index started to fall early this month, probably indicating slowing home sales, but has risen slightly over the last couple of weeks (these numbers are seasonally adjusted).
Mortgage interest rates continued to rise:
The average contract interest rate for 30-year fixed-rate mortgages increased to 6.33 percent from 6.31 percent on week earlier...This is up from 6.06 percent three weeks ago.
The average contract interest rate for 15-year fixed-rate mortgages increased to 5.87 percent from 5.85 percent...This is up from 5.37 percent three weeks ago.
Tuesday, November 15, 2005
DataQuick: Southland home sales, prices still near peak
by Calculated Risk on 11/15/2005 06:32:00 PM
DataQuick reports on Southern California: Southland home sales, prices still near peak
Southland home sales were up slightly for the third month in a row, led by strong sales in the Inland Empire and increased inventory levels regionwide. Appreciation rates remain in the mid-teens, a real estate information service reported.DataQuick President Marshall Prentice remains optimistic:
A total of 28,489 new and resale homes were sold in Los Angeles, Riverside, San Diego, Ventura, San Bernardino and Orange counties last month. That was down 10.2 percent from 31,470 in September, and up 1.1 percent from 28,189 for October last year.
"The big question is still whether or not the real estate market will end this cycle with a crash, or with a soft landing. Right now the latter scenario is still the most likely. Home values have doubled in the past four years and almost all, if not all, of those gains are here to stay."
Orange County: Home Prices Decline for 2nd Month
by Calculated Risk on 11/15/2005 12:32:00 PM
The OC Register reports: Sales price for O.C. housing drops for second month
Orange County's housing market continues to cool as overall sales prices fell for the second straight month.These numbers are not seasonally adjusted:
DataQuick reported today that the median sales price for all types of O.C. residences in October was $606,000 -- that's down $4,000 from September and down $11,000 from the record high set in August, $617,000.
Still, October's price was up 14 percent from the median a year before.
Sales of 3,614 homes and condos -- resales and new construction -- closed last month. That's up 3 percent from October of last year.
October's overall 0.7 percent price drop is no big surprise. Since 1988, Orange County home prices have fallen on average by 0.4 percent in the month of October. Prices have dropped in October in 11 out of the past 18 years.
October is one of four months where home prices typically drop, according to DataQuick figures. July, September and October –- three months with historically falling prices -- reflect a typical sales slowdown after the spring's peak selling season. From 1988 to 2004, home prices appreciated a combined 6.7 percent in February through June –- but just 0.4 percent the rest of the year.
Housing: Hot Prices and Anti-Bubble Reports
by Calculated Risk on 11/15/2005 11:37:00 AM
The AP reports: Home prices show sharp increases
The nation's booming housing market continued to push prices higher in the summer and early fall with 69 metropolitan areas reporting double-digit increases compared with a year ago, a real estate trade group reported Tuesday.The National Association of Realtors presents "anti-bubble reports" for 130 markets with the lead:
The National Association of Realtors said that the median price of an existing home rose by 14.7 percent in the July-September quarter to $215,900, compared with a median price of $188,200 a year ago. The median is the midpoint where half the homes sold for more and half for less.
Led by Phoenix, Ariz., and Orlando, Fla., the nation's hottest markets far outperformed the nationwide figure. The price of existing homes sold during the third quarter in the Phoenix-Mesa-Scottsdale area jumped to $268,000, a whopping 55.2 percent higher than the same period a year ago. Orlando has the second biggest increase, a gain of 44.8 percent to $261,300, followed closely by Cape Coral-Fort Myers, Fla., where home prices were up 42.5 percent to $277,600.
Some economists have expressed concern that demand for housing in some parts of the country is being driven by a speculative frenzy that could burst the price bubble as mortgage rates continue to climb. Freddie Mac's nationwide survey showed that the 30-year mortgage hit 6.36 percent last week, the highest level in more than two years.
However, most analysts believe that rising mortgage rates will simply moderate the double-digit gains in home prices that home sellers have enjoyed in recent years, rather than cause sharp declines in home prices.
...
The Realtors' latest survey showed that 69 metropolitan areas - nearly half of the 147 areas surveyed - enjoyed double-digit price gains in the July-September quarter compared with a year earlier.
These downloadable 10-page reports show that the facts simply do not support the possibility of a housing bust -- not for these 130 markets and not for the nation.
Monday, November 14, 2005
Housing: The Big Chill
by Calculated Risk on 11/14/2005 08:55:00 PM
CBS reports: Chill Settles Over Housing Market
"There is evidence of a cooling going on nationwide," she tells The Early Show co-anchor Julie Chen. "Median prices are falling some, inventory is up, rents are up, mortgage applications are down and if you look around, you probably see more signs for open houses, something that wasn't necessary just a couple of months ago. And more of those 'price reduced' signs as well, particularly in the luxury market.And the most "chilling" advice for sellers:
"What's been happening, specifically, over the past couple of months is you have all these people putting their homes on the market. Investors and individuals alike are testing the market to some degree to see if they can cash out and get out while the going's good. That is pushing inventory up.
"But buyers aren't jumping in feet first, as they were just a couple of months ago. They are taking their sweet time and they can actually afford to take a little more time. There's more of a balance now between the buyers and the sellers that we haven't seen in quite awhile.
"You're probably not going to get the price you wanted for a comparable home six months ago."
Home Equity Extraction
by Calculated Risk on 11/14/2005 12:21:00 AM
My most recent post is up on Angry Bear, Housing: "With a pfffffffft or a fizzle"
On equity extraction, Freddie Mac reported on Nov 1st: CASH-OUT REFINANCE ACTIVITY STRONG IN THIRD QUARTER 2005
"Refinancing activity was strong in the third quarter, even with higher interest rates with 44 percent of new mortgage applications being submitted for refis," said Amy Crews Cutts, Freddie Mac deputy chief economist. "The large share of borrowers who took cash out when refinancing their mortgages combined with the strong overall refinance volume led to an extraction of home equity through prime first-lien refinances of $60.4 billion, almost equal to the revised estimate of $60.7 billion extracted in the second quarter. With the expectation that mortgage rates will rise further in the fourth quarter, refinance volumes overall should slow but cash-out refis will continue to be in demand, and equity extraction through refinance should hit over $200 billion this year, falling to about $114 billion in 2006."So far equity extraction remains strong.
Sunday, November 13, 2005
San Diego: Home Prices and Inventory
by Calculated Risk on 11/13/2005 08:32:00 PM
The San Diego Union Tribune reports: 'Median home price tops $500,000, a first'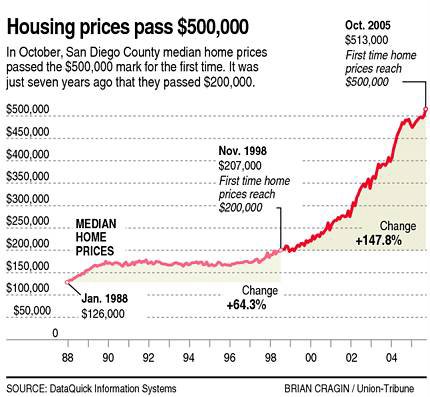 Click on graph for larger image.
The year-over-year increase to $513,000 was 4.9 percent above October 2004's $489,000, the sixth month in a row that appreciation has been below 10 percent.And on inventories and foreclosures:
October was the 16th month in a row that sales volume has declined on a year-over-year basis. The total last month was 4,155, down from 4,758 a year ago.
In a separate report from the San Diego Association of Realtors, the inventory of active, unsold listings crossed the 15,000 mark for the first time since the present boom began in 1997. By contrast, at the peak in March last year, there were only 3,113 listings.Foreclosures are still very low, but rising. The story doesn't provide the exact inventory number, but the inventory to sales ratio is about 3.6 months - still within the normal range.
Coupled with rising interest rates – which rose to a two-year high of 6.31 percent this week – and a suddenly soaring foreclosure notice rate – up nearly 40 percent for the third quarter compared with a year ago – industry analysts said San Diego's housing boom seems to be coming to a quiet end.
...
... there are early signs of distress. DataQuick's Karevoll said the notice of default rate – the first sign of foreclosure – soared nearly 40 percent to 906 notices in the third quarter. But he said it was far below the peak of 5,139 in the first quarterly of 1996. Only 47 actual foreclosures occurred in the third quarter, compared with 33 a year ago.
Friday, November 11, 2005
Drucker on Bubbles
by Calculated Risk on 11/11/2005 08:05:00 PM
Management Guru Peter Drucker, 95, Dies
Innovation, listening to your customers, taking care of your employees - it all seems so obvious today. It wasn't so obvious 60 years ago. Here are a few quotes from Drucker:
On bubbles:
"Pigs gorging themselves at the trough are always a disgusting spectacle, and you know it won't last long."
"The average duration of a soap bubble is known. It's about 26 seconds," Drucker said. "Then the surface tension becomes too great and it begins to burst.On metrics:
"For speculative crazes, it's about 18 months."
"Checking the results of a decision against its expectations shows executives what their strengths are, where they need to improve, and where they lack knowledge or information."On Leadership:
"Effective leadership is not about making speeches or being liked; leadership is defined by results not attributes."
"Executives owe it to the organization and to their fellow workers not to tolerate nonperforming individuals in important jobs."
Housing: Foreclosures and Unemployment
by Calculated Risk on 11/11/2005 04:36:00 PM
First comes rising housing inventories, then slowing activity and less mortgage extraction, followed by a drop in retail sales, rising foreclosures, falling house prices and less housing related employment. At least that is the general sequence I expect.
In Massachusetts, inventories to sales is already over 8 months, prices have started to fall and foreclosures are rising: A rise in foreclosures
Don't look now, but that whistling sound you're hearing is the air leaking out of the housing bubble.And from Australia, a country that has already seen falling housing prices: Unemployment rate rises further
...
More disturbing yet is a sharp rise in foreclosures. Over the first nine months of this year, foreclosures in Massachusetts are up 33 percent over the same period in 2004.
"We are seeing a big increase, we've seen a steady increase, and there's going to be more going forward," Jeremy Shapiro, president and co-founder of Framingham-based ForeclosuresMass.com said.
Behind the figures lie several factors. Zero-interest mortgages allowed buyers to borrow more than they could afford. Interest rates are going up, pushing up payments for those holding adjustable-rate mortgages. Families mortgaged to the hilt can't handle it when one earner loses a job or some unexpected expense comes up.
Job-shedding in Australia has extended into a second month.Most of the United States is in the 'rising inventories' phase, but these stories depict the probable future for much of the US.
A plunge in full-time job numbers has more than offset a solid rise in part-time positions.
Official figures show full-time places slumped in October by 60,800 - the worst outcome since the 1991 recession.
The number of people looking for work has declined, and that has kept a lid on the rise in the jobless rate.
It now stands at 5.2 per cent.
FRBSF Economic Letter: Spendthrift Nation
by Calculated Risk on 11/11/2005 01:08:00 PM
Senior economist Kevin J. Lansing of the San Francisco Federal Reserve Bank writes: Spendthrift Nation
In September 2005, the personal saving rate out of disposable income was negative for the fourth consecutive month. A negative saving rate means that U.S. consumers are spending more than 100% of their monthly after-tax income. The recent data are part of a trend of declining personal saving rates observed for two decades. During the 1980s, the personal saving rate averaged 9.0%. During the 1990s, the personal saving rate averaged 5.2%. Since 2000, the personal saving rate has averaged only 1.9%.Dr. Lansing presents a model of wealth effects on savings and compares the model to actual data:
This Economic Letter discusses some of the factors that appear to be driving the secular decline in the personal saving rate. These factors include rapid increases in stock market and residential property wealth, which households apparently view as a substitute for the quaint practice of putting aside money each month from their paychecks. Rapidly rising stock and house prices, fueled by an accommodative environment of low interest rates and a proliferation of "exotic" mortgage products (loans with little or no down payment, minimal documentation of income, and payments for interest-only or less) have sustained a boom in household spending and provided collateral for record-setting levels of household debt relative to income.
Going forward, the possibility of cooling asset markets and rising borrowing costs may cause the personal saving rate to revert to levels which are more in line with historical averages. While such a development would act as near-term drag on household spending and GDP growth, an increase in domestic saving would help correct the large imbalance that now exists in the U.S. current account (the combined balances of the international trade account, net foreign income, and unilateral transfers).

Figure 4 plots the U.S. personal saving rate together with the fitted saving rate from the model. The simple behavioral model can account for 89% of the variance in the U.S. personal saving rate from 1960:Q1 to 2005:Q1. A slightly improved fit can be obtained by adding a time trend to the regression equation. A time trend is a proxy for ongoing credit industry innovations (growth of subprime lending, home equity loans, exotic mortgages, etc.) which have expanded consumer access to borrowed money and reduced the need for precautionary saving.Hat tip to Joshua for sending me the article!
Figure 4 suggests that the decades-long decline in the U.S. personal saving rate is largely a behavioral response to long-lived bull markets in stocks and housing together with falling nominal interest rates over the same period. Since 2000, the rate of residential property appreciation has been more than double the growth rate of personal disposable income. In many areas of the country, the ratio of house prices to rents (a valuation measure analogous to the price-earnings ratio for stocks) is at an all-time high, raising concerns about a housing bubble. Reminiscent of the widespread margin purchases by unsophisticated investors during the stock market mania of the late-1990s, today's housing market is characterized by an influx of new buyers, record transaction volume, and a growing number of property acquisitions financed almost entirely with borrowed money.
According to the model, the personal saving rate would be expected to halt its decline and start moving up if stock or housing markets sagged, or if long-term interest rates jumped, say, due to inflation fears. An increase in the personal saving rate would slow the growth of household spending which, in turn, would have negative implications for the derived demands of business investment, inventory accumulation, and business hiring. But, on a positive note, a pickup in saving activity in the household sector would help offset the ongoing deficit spending in the government sector. A rise in net domestic saving would reduce the U.S. economy's reliance on foreign capital inflows as a source of saving. At present, the U.S. current account deficit stands at more than 6% of GDP, implying that the U.S. economy must draw in around $3 billion per day from foreign investors to finance domestic spending.
Housing Affordability and More
by Calculated Risk on 11/11/2005 11:50:00 AM
First, two articles on DC and Phoenix:
Housing Market Cooling, Data Say
In Washington, Sales Are Down, Inventory Is Up
The trend is most striking in Northern Virginia, where most of the region's growth has occurred, but it is evident almost everywhere. Statistics on home sales released by Metropolitan Regional Information Systems Inc., the regional multiple-listing service, show that:Phoenix: Housing market cools ... along with weather
In the two counties and three cities that make up the Northern Virginia market, more than twice as many homes were available for sale in October as in the same month one year ago -- 7,122 homes, compared with 3,254 -- and sales are off 28 percent.
In the District, listings are up 62 percent and sales are down 28 percent.
In Montgomery County, listings are up 49 percent and sales are down 8 percent.
In Prince George's County, the listings are up 45 percent. But home sales have remained fairly stable, dropping only 2.6 percent.
The last time the region had this many houses for sale was the late 1990s, the MRIS figures show.
Phoenix real estate executive Rich Rector has been seeing something unusual lately as he makes his rounds: "Open House" signs.And on affordability: C.A.R. reports California's Housing Affordability Index fell four points to 15 percent in September
...
Whatever the reasons, there are signs the frenzy is coming to an end. There are now 17,000 residential properties listed for sale, up from just 5,000 a few months ago, and would-be buyers have regained some of their bargaining power.
The percentage of households in California able to afford a median-priced home stood at 15 percent in September, a 4 percentage-point decrease compared with the same period a year ago when the Index was at 19 percent, according to a report released today by the California Association of REALTORS® (C.A.R.). The September Housing Affordability Index (HAI) increased 1 percentage point compared with August, when it stood at 14 percent.
Thursday, November 10, 2005
Housing Inventory: DC and Tucson
by Calculated Risk on 11/10/2005 01:28:00 PM
Inventories continue to rise. The following graph (thanks to DC Broker DC1000) shows sales and active listing over the last year:
Click on graph for larger image.
Although inventories have surged since August, the ratio of inventory to sales is only 3.44 - still low by historical standards.
Also, prices have been mostly flat over the last 7 or 8 months. And days on market hasn't risen substantially yet.
In Tucson, The Daily Star reports: Tucson-area home-price rise resumes. The lead is the small increase in area prices, but inventories reached a ten year high:
Tucson-area home values broke out of a four-month malaise in October, with the median sale price increasing by $5,000 to $224,000.Tucson's inventory to sales ratio is now 3.9 months.
But the number of homes available for sale in the metropolitan area has reached a 10-year-high, suggesting that Tucson's housing market is becoming more favorable to buyers.
...
Although active listings climbed to 5,330, the market appears healthy, said Judy Lowe, president of the Tucson Association of Realtors Multiple Listing Service. With more homes for sale, Vest said, the market pendulum is swinging back toward buyers, but it "still has a long way to go."
...
The number of houses sold was down 2.6 percent, from 1,404 in September to 1,368 in October. October's sales were still up by 5.6 percent compared with the 1,295 homes sold in October 2004.
September Record Trade Deficit: $66.1 Billion
by Calculated Risk on 11/10/2005 08:30:00 AM
The U.S. Census Bureau and the U.S. Bureau of Economic Analysis released the monthly trade balance report today for September:
"... total September exports of $105.2 billion and imports of $171.3 billion resulted in a goods and services deficit of $66.1 billion, $6.8 billion more than the $59.3 billion in August, revised.Note: all numbers are seasonally adjusted.
September exports were $2.8 billion less than August exports of $108.0 billion. September imports were $4.0 billion more than August imports of $167.3 billion."

Click on graph for larger image.
The September record was the result of both a sharp drop in exports and a significant increase in imports.
Imports from China set another record of $23.307 Billion, while exports to China were off from August ($3.2 Billion vs. $3.9 Billion). Imports from Japan were off slightly to $10.9 Billion.

The average contract price for oil set a new record of $57.32 per barrel breaking the old record of $52.65 in July. Crude oil imports dropped significantly, but the quantity of refined products increased. On a NSA basis, the value for September imports was the same as August petroleum imports.
The SA petroleum trade deficit set another record of $22.2 Billion.
This was a difficult month to forecast due to the hurricanes.
Wednesday, November 09, 2005
Remarks by John C. Dugan, Comptroller of the Currency
by Calculated Risk on 11/09/2005 09:47:00 PM
Here is the text of John Dugan's recent remarks at the OCC Credit Risk Conference. It is an easy read and well worth the few minutes. Dugan makes several key points:
1) This is the top of the credit cycle and standards are slipping.
2) Risk is overly concentrated in commercial real estate and residential mortgages.
3) Certain loans are especially risky.
4) The goal for the new interagency guidance is the end of 2005.
This is the "top of the credit cycle":
"... it’s at the top of the credit cycle where stresses and weaknesses typically appear, so what we are seeing today should not surprise anyone. With liquidity pouring into the market, we would expect to see increased competition for loan customers – and we are. With competition intensifying, we would expect to see underwriting standards easing – and we are. And we would expect to find emerging concentrations in some loan categories, such as commercial and residential real estate. We are most definitely seeing that."And there is concern about mortgage risk:
"Today’s non-traditional mortgage products – interest-only, payment option ARMs, no doc and low-doc, and piggyback mortgages, to name the most prominent examples – are a different species of product, with novel and potentially risky features.And more on Option ARMs:
...
This dominance is increasingly reflected in the numbers. By some estimates, interest-only products constituted approximately 50 percent of all mortgage originations last year. In the first half of 2005, IOs started to decline in favor of payment-option ARMs, which, according to one source, comprised half of new mortgage originations. And roughly every other mortgage these days is also a “piggyback” or reduced documentation mortgage, which points to another development that concerns us: the trend toward "layering" of multiple risks. There is no doubt that when several risky features are combined in a single loan, the total risk is greater than the sum of the parts.
We can readily understand why these new products have become fixtures in the marketplace in such a short time. One reason is that they have helped sustain loan volume that would otherwise almost certainly be falling, because rising interest rates have brought an end to the refinance boom. More important, lenders have scrambled to find ways to make expensive houses more affordable – although there’s now a concern that the very availability of this new type of financing has done its share to help drive up house prices, which in turn stimulates demand for even more non-traditional financing."
"And then there are payment-option ARMs, which take us to another level of risk. ... borrowers can easily treat payment-option ARMs in the same manner as a traditional mortgage, simply by selecting the fully amortizing option rather than the minimum payment option each month.And on the new interagency mortgage guidance project:
In practice, however, few borrowers treat them that way. Recent studies show that a significant number of borrowers are frequently choosing to pay the minimum amount possible, a payment amount that typically falls short of the interest accruing on the loan. Even more disturbing, this choice does not seem limited to high quality, affluent borrowers who may be using the product as a payment flexibility tool. The research indicates that borrowers at both ends of the FICO spectrum make this choice, with riskier borrowers resorting to it most frequently. Because such minimum payments fall considerably short of the total interest accruing each month, the unpaid interest is added to the loan principal, and negative amortization occurs. Thus, it should come as no surprise that, of the least creditworthy holders of payment-option ARMs, nearly 50 percent have current balances above their original loan amount."
"This guidance will focus on underwriting standards, appropriate disclosure, and portfolio management concerns. Our current goal is to ready the guidance for release by year’s end, although serious interagency discussions about the initial draft have only just begun."Well worth reading.
Bernanke and the Housing Bubble
by Calculated Risk on 11/09/2005 08:51:00 PM
The Center for Economic and Policy Research released a new report today: "Will a Bursting Bubble Trouble Bernanke? The Evidence for a Housing Bubble". Dean Baker and David Rosnick conclude:
This paper has briefly examined three trends that strongly support the view that the recent run-up in house prices is driven by a speculative bubble, rather than fundamentals. First, it notes the unusual gap between the run-up in home sale prices and rents at both the national level and in many of the most inflated metropolitan markets. .... When such gaps have developed in the past, they usually have been followed by sharp declines in house sale prices.
The second factor suggesting that the current run-up reflects a bubble is the extraordinary pace of home construction in recent years. ... This pace of construction substantially exceeds that rate of new household formation. It is also worth noting that virtually no economists projected a sharp price in home construction in the mid-nineties, so most of the economists who expect the current pace of housing construction to persist, badly erred in their projections for housing construction in the past.
Finally, the wealth effect resulting from the recent run-up in house prices has led to a sharp decline in the savings rate. In recent months, the savings rate has turned negative. If construction continues at its recent pace and real house prices stay at current levels, then the savings rate will become even more sharply negative over the next decade.
...
It is not plausible that an economy will sustain a negative savings rate for any substantial period of time. This would imply that households’ non-housing wealth is continually declining. The more likely scenario is that housing prices will fall back in line with their historic values.
...
The costs of a collapse of the housing bubble will be even greater than the costs of the collapse of the stock bubble, because housing wealth is much more evenly held. The failure of the economics profession to adequately warn of the stock bubble was an act of extraordinary negligence. Missing the housing bubble is an even bigger mistake.
Prediction: September Trade Deficit
by Calculated Risk on 11/09/2005 06:14:00 PM
The Census Bureau will report the Trade Balance tomorrow morning. The concensus forecast is for a record trade deficit of $61.3B for September.
The impact of the hurricanes is a little uncertain. The Census Bureau has released preliminary trade information for the Gulf Region showing that exports were off about $1 Billion for the Port of New Orleans in September. However, imports were also off (about $0.5 Billion) and other Gulf ports picked up some of the export and import slack. My guess is exports will be impacted slightly - maybe $0.5 Billion.
Crude oil imports were off, but the volume of more expensive refined products increased. My prediction for the petroleum trade deficit is $21.1 Billion SA; a slight increase from the August record of $20.6 Billion.
The West Coast ports of Los Angeles and Long Beach reported record inbound traffic for September. Export traffic was down. Seasonally adjusted, imports from China were probably around the August level.
My prediction: A record trade deficit of $60.5 Billion.
DiMartino: Follow the Housing insiders' money
by Calculated Risk on 11/09/2005 04:38:00 PM
DiMartino follows the money:
...it's a good thing the people running the homebuilding companies got out when they did.
So far this year, insiders at Toll have sold $588 million worth of the company's stock – representing nearly 10 percent of the current market capitalization. Robert Toll, chief executive, has liquidated north of $110 million.
As a group, Thomson Research senior quantitative analyst Mark LoPresti said, industry insiders have sold $976 million in 2005.
...
In the last six months, homebuilders have sold, on average, $347 for every dollar they've spent purchasing their own stock. Compare that to all industries, where insiders have sold $31 in stock for every dollar they bought.
Mr. LoPresti said July was the key month for homebuilder shareholders to watch what insiders were doing with their own shares.
"In July alone, homebuilding insiders liquidated 4.8 million shares of stock, the largest number in history, raising $333 million," Mr. LoPresti said.
The last time homebuilder insiders were this aggressive was May 1991, when they sold off 3.1 million shares in one month. This was followed by a 27 percent decline in homebuilder stocks over the next four months.
Tuesday, November 08, 2005
WSJ Econoblog: Changing Times at the Fed
by Calculated Risk on 11/08/2005 10:32:00 PM
Drs. Tim Duy and William Polley discuss Bernanke and the FED: Changing Times at the Fed This is an excellent discussion of a number of topics: Fed credibility, inflation targeting, inflation measures, "global savings glut" and more.
NOTE: Here is Dr. Polley's blog and Dr. Duy writes the regular Fed Watch feature on Dr. Thoma's Economist's View.
From the WSJ Econoblog: Both Drs. Duy and Polley believe Bernanke's "helicopter drop" comments were misunderstood by the general public. See this 2002 Bernanke speech: Deflation: Making Sure "It" Doesn't Happen Here
Dr. Polley comments:
In one line of his speech, Mr. Bernanke uses the illustration of the "helicopter drop" of money -- an illustration first used by Milton Friedman -- to describe a money-financed tax cut that should have the desired effect of ending the deflation. It was, of course, widely acknowledged that the risk of deflation was slight and that this was a "worst case" scenario.Dr. Duy concurs:
Fortunately, deflation did not materialize, but many people worried that Mr. Bernanke's use of this illustration weakened his credentials as an inflation fighter. I don't share that concern, but beliefs and expectations are very important in central banking. Any doubt about the Fed's credibility means that they will have to raise the real rate further to re-establish those credentials.
I have worried that continued allegations of Mr. Bernanke as an inflationist -- allegations that I believe are false -- are increasing the possibility of policy error in the months ahead. That said, I believe that my worries will prove to be unfounded at the end of the day.An excellent discussion.
Housing and the Economy
by Calculated Risk on 11/08/2005 06:31:00 PM
Here are some interesting comments today on the impact of a housing slowdown on the economy:
Marketwatch: Bell 'Toll-ing' for housing market?
Toll Bros. warning fuels worries bubble set to finally pop
"If housing prices do not go up as much and interest rates are rising at the same time, fewer people will be able to take equity out of their homes," said Simon at Pimco.Reuters: U.S. stocks fall on concern about housing slowdown
"People are not only going to feel a lot less rich but they are going to have less money to spend," he added. "That can definitely hurt GDP."
"A soft real-estate market is not good for the consumer. It is not going to bode well going forward," said Weston Boone, vice president of listed trading at Legg Mason Wood Walker. "You have to take into consideration the rising interest-rate environment. There aren't a lot of catalysts for positive sentiment in the market."Investors Squeamish on Housing Outlook
"It would be a bit ominous for the economy if we see a dramatic slowdown in the housing sector," said Michael Metz, chief investment strategist at Oppeheimer & Co.What comes next? A slowdown in retail spending or real estate related job losses?
"The whole economy has been built on the wealth impact of the housing sector," Metz said.
Toll Brothers Warns
by Calculated Risk on 11/08/2005 10:53:00 AM
AP reports: Toll Brothers Cuts 2006 Home Deliveries View; Sees Weakened Demand in Some Markets
Toll Brothers Inc. cut its home deliveries forecast for fiscal 2006 on Tuesday, citing fewer than expected selling communities and weakened demand in several markets. Shares of the luxury home builder tumbled more than 11 percent in morning trading.
Toll Brothers projected home deliveries between 9,500 and 10,200 homes in fiscal year 2006, down from an earlier target of 10,200 to 10,600 homes. In fiscal 2005 it reported 8,769 deliveries.
"The shortage of selling communities, coupled with some softening of demand in a number of markets, negatively impacted our contract results," Toll Brothers said. "It appears we may be entering a period of more moderate home price increases, more typical of the past decade than the past two years."
Monday, November 07, 2005
Leaving California
by Calculated Risk on 11/07/2005 12:58:00 AM
My most recent post is up on Angry Bear: Will Boston Lead the Housing Bust?
Also, one of my friends is leaving California to take a job in Indiana. He currently lives in the Inland Empire and had a choice of living in Orange County or Indiana. The price of housing was the determining factor.
Apparently this is becoming more common - from the NY Times: Saying Goodbye California Sun, Hello Midwest
A growing number of people are leaving California after a decade of soaring home prices, according to separate data from the Census Bureau, the Internal Revenue Service and the state's finance department.
Last year, a half million people left California for other parts of the United States, while fewer than 400,000 Americans moved there. The net outflow has risen fivefold, to more than 100,000, since 2001, an analysis by Economy.com, a research company, shows, although immigration from other countries and births have kept the state's population growing.
The number of people leaving Boston, New York and Washington is also rising, and skyrocketing house prices appear to be a major reason, said Mark Zandi, chief economist at Economy.com. From New York, the net migration to Philadelphia more than doubled between 2001 and 2004, with 11,500 more people leaving New York for Philadelphia last year than vice versa. The number of New Yorkers who have moved to Albany, Charlotte, N.C., and Allentown, Pa., among other places, has also increased sharply.
Friday, November 04, 2005
Interest on the National Debt
by Calculated Risk on 11/04/2005 05:49:00 PM
The average weighted interest rate on the National Debt will most likely rise in fiscal 2006. For fiscal 2005 (ended Sept 30th), the average interest rate was 4.6%. The rate rose to 4.74% in October.
Click on graph for larger image.
With continued heavy borrowing, a significant amount of debt due to rollover in early 2006, and rising interest rates, the weighted average rate will probably rise to 5% or more for fiscal 2006.
NOTE: 2006 is estimated at 5%.
The implications for the budget deficit are serious. The National Debt has increased substantially in recent years, while interest rates have been falling. This has kept the debt service payments in the low to mid $300 Billion range.
Now that interest rates are rising, the additional interest payments will add significantly to the General Fund deficit. A small increase to 5% of the weighted average interest rate will add $59 Billion to the fiscal 2006 General Fund deficit compared to fiscal 2005 debt service.
NOTE: Graph shows an estimated fiscal 2006 interest payment of $411 Billion.
Debt service is part of the reason I believe the National Debt will increase by a record $650 Billion in fiscal 2006. The US set an October record debt increase of $94.4 Billion - well on the way to an annual record.
October Jobs Report
by Calculated Risk on 11/04/2005 11:24:00 AM
The BLS released the Emploment Situation Summary this morning.
On Housing: Kash has some interesting comments on construction employment at Angry Bear: Disappointing Job Growth Here are some stats for October: Total jobs added: 56K.
1.8K .... Residential building
20.0K .. Residential specialty trade contractors
5.4K ... Depository credit intermediation (includes mortgage brokers)
3.3K ... Real estate
Total RE related = 30.5K
Previous economic releases have shown that construction spending and new home starts are still rising. This employment report is further confirmation that the building boom is continuing, even though the housing market appears to be slowing.
On overall employment: Bush's first term, with a net loss of 759K private sector jobs (a gain of 119K total jobs), was a disappointment. For Bush's 2nd term, anything less than 6.8 Million net jobs will have to be considered poor. And anything above 10 million net jobs as excellent. Of course, in additional to the number of jobs, the quality of the jobs and real wage increases are also important measures.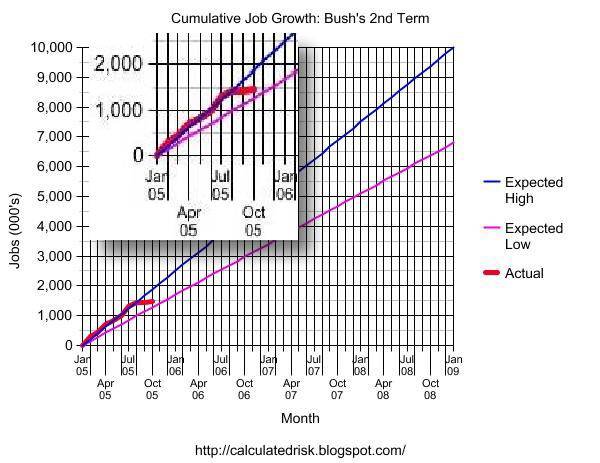
Click on graph for larger image.
For the quantity of jobs, this graph provides a measurement tool for job growth during Bush's 2nd term.
The blue line is for 10 million jobs created during Bush's 2nd term; the purple line for 6.8 million jobs.
The insert shows net job creation for the first 9 months of the 2nd term - the last three months have moved job creation towards the lower end of the acceptable range.


